
 Search Knowledge Base
Projects
Add metadata

Add data
Reports
A report can be used to analyze multiple trials simultaneously, either to compare different conditions and/or sessions, or to analyze consistency within a condition. In a report numeric data is combined and overlaid in graphs and video’s from different trials can be played back (in a synchronized manner if your data contains the required information) and viewed right next to each other (see section Split screen). Reference data can also be added into a report, to match your trial(s) with healthy age-matched peers or others (see section Reference data). Instruction for manually creating a report can be found in the section “How to create a report manually”. If enabled, reports can also be generated automatically, see “How to create reports automatically” for details.
How to create a report manually
- First you need to go into editing mode of a session. You can reach this page by clicking the session name or the pencil next to a session's name in the left navigation menu or on the subject home page.
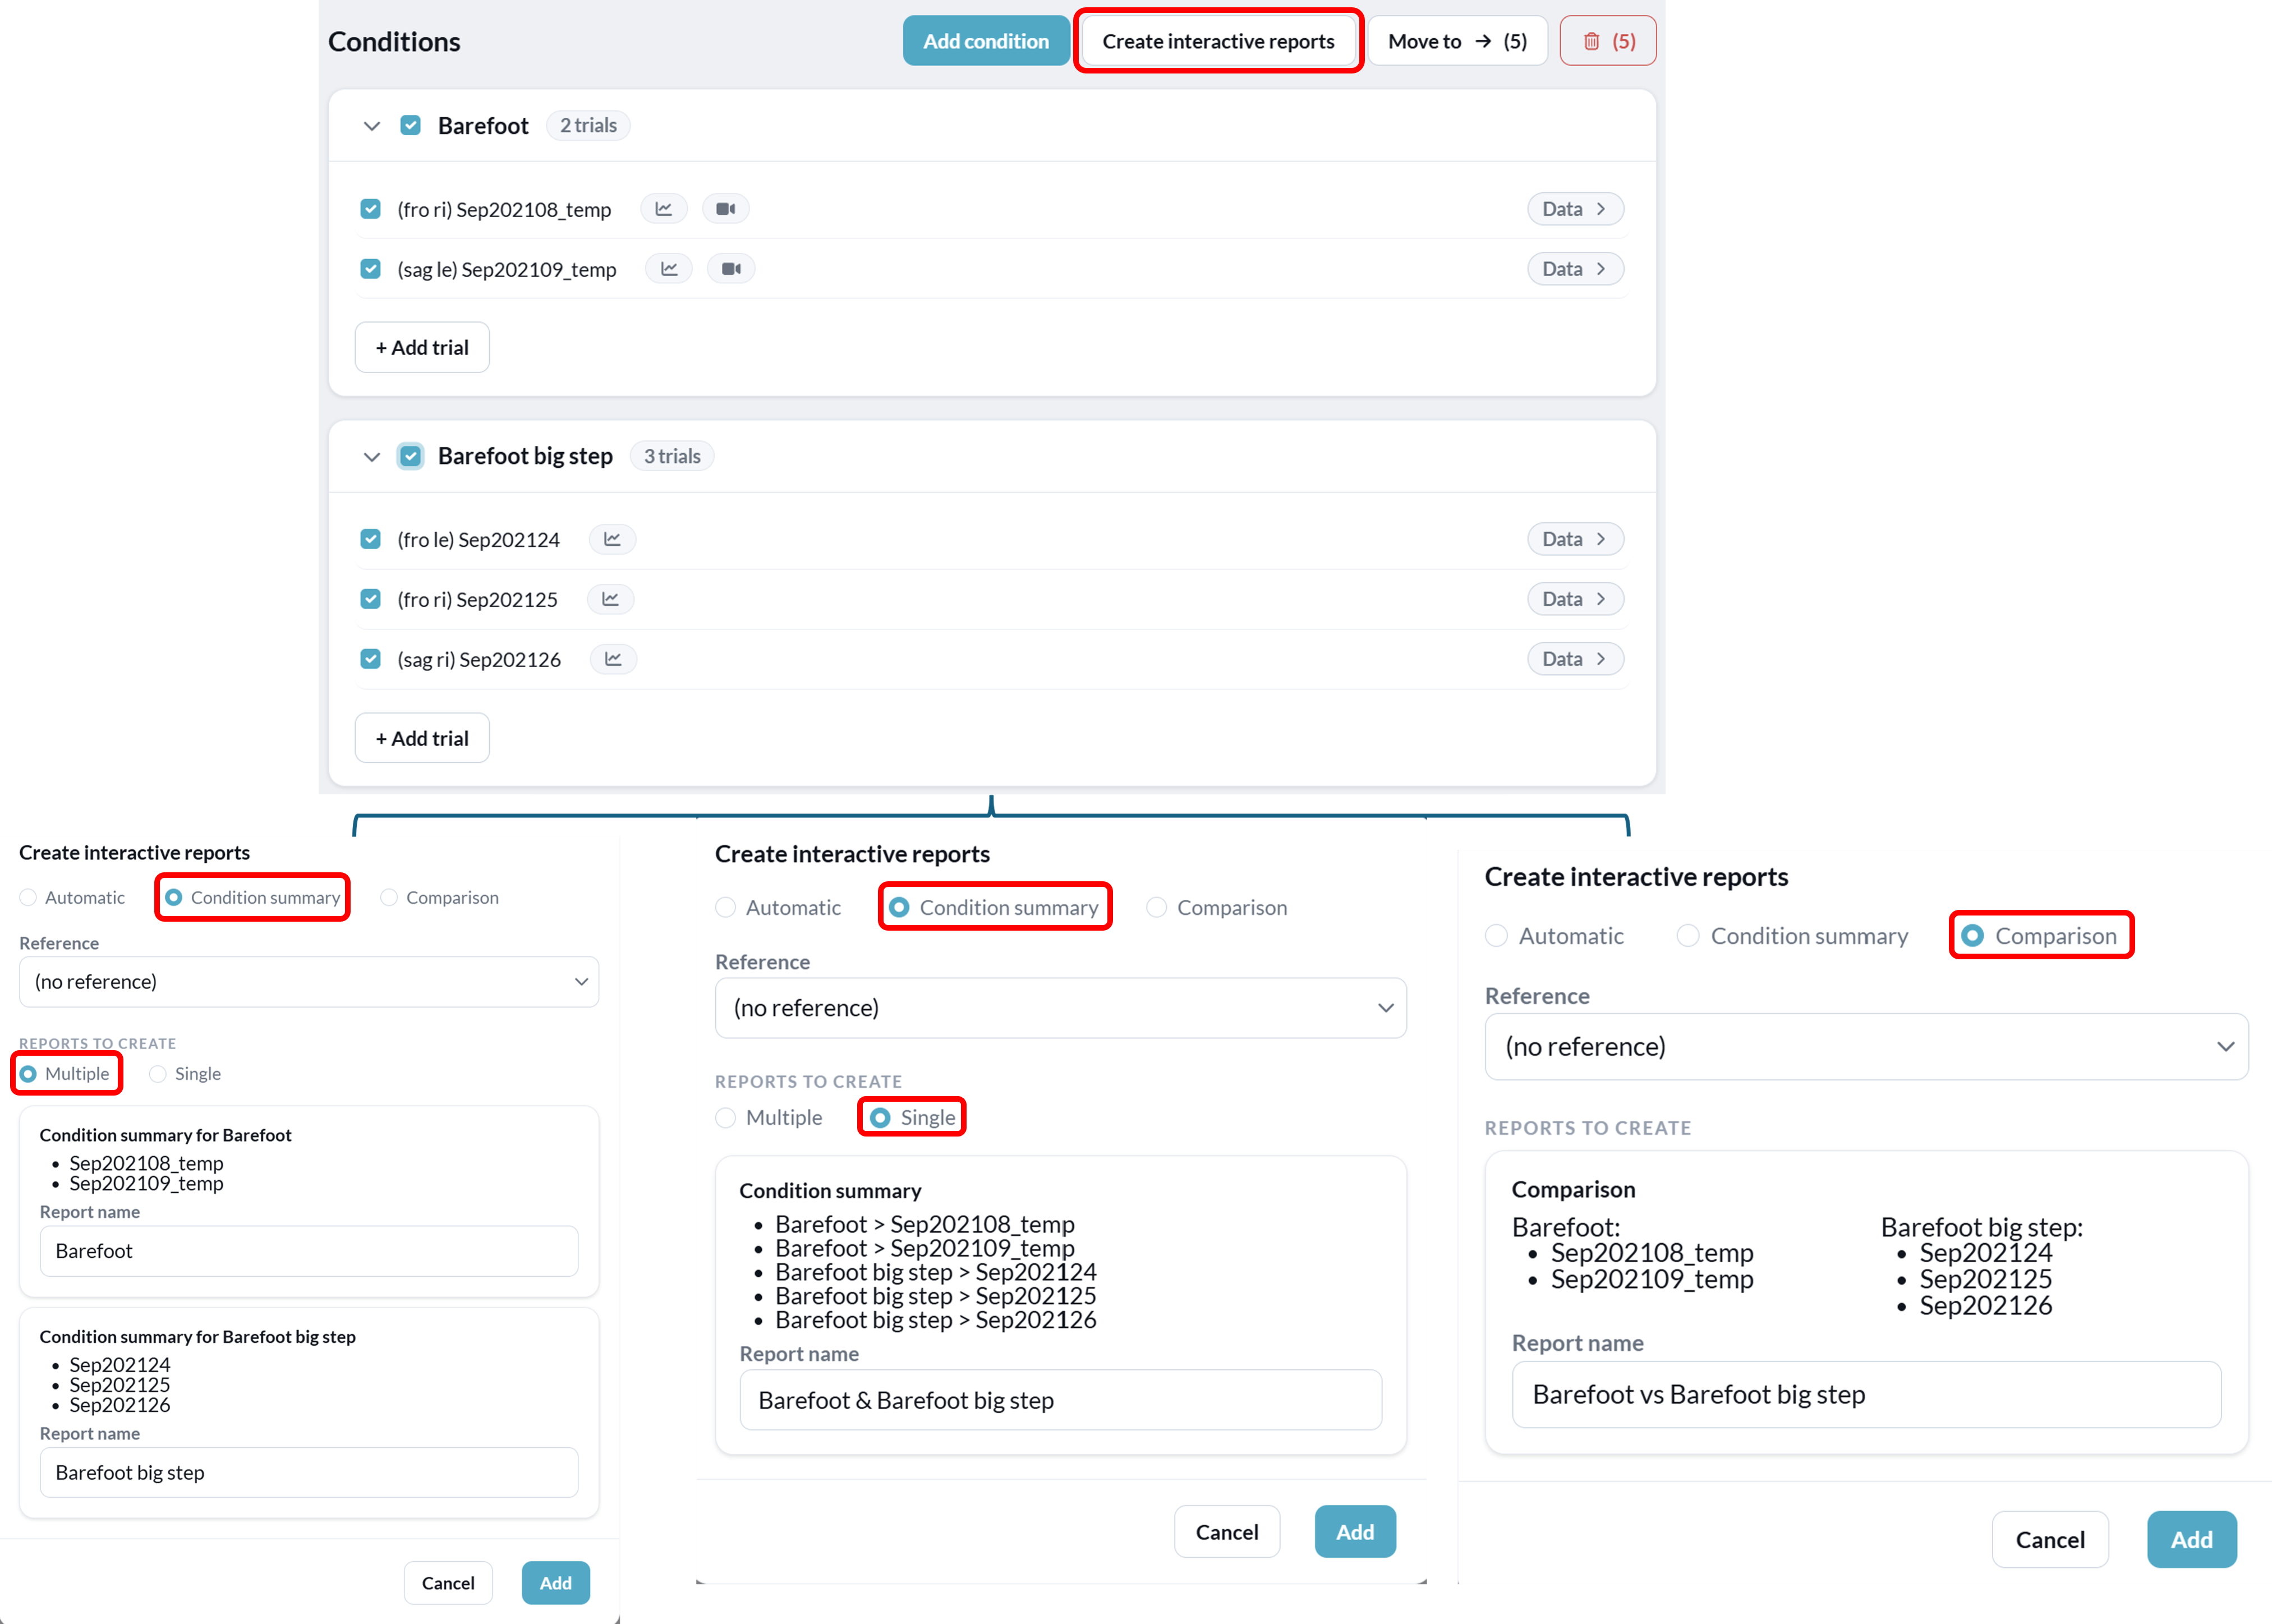
- Select the trials/conditions you want to include in your report(s) by checking the checkbox next to the trial or condition (see image below) and click on ‘Create interactive reports’.
- You can select trials/conditions within the same session or different sessions. Click another session below your current one to expand and select those trials.
- Select the report type (Condition summary or Comparison). See below for more information on the different report types.
- You can change the report template and add Reference data to the reports. Note that this will be applied to all reports you're creating in this workflow.
- Rename the reports if necessary.
- Click 'Add' to create the report. The report will be placed within the session from which you initiated the creation of the report.
Condition summary
Comparison
How to create reports automatically
This feature is optional and only visible to Enterprise customers with this feature enabled.When working with a standard set of commonly required reports, you can streamline the process by using automatic report creation. This allows you to generate a predefined set of reports efficiently. These can include condition summaries, condition comparisons, and session comparison reports.
- How to use the automatic report creation feature:
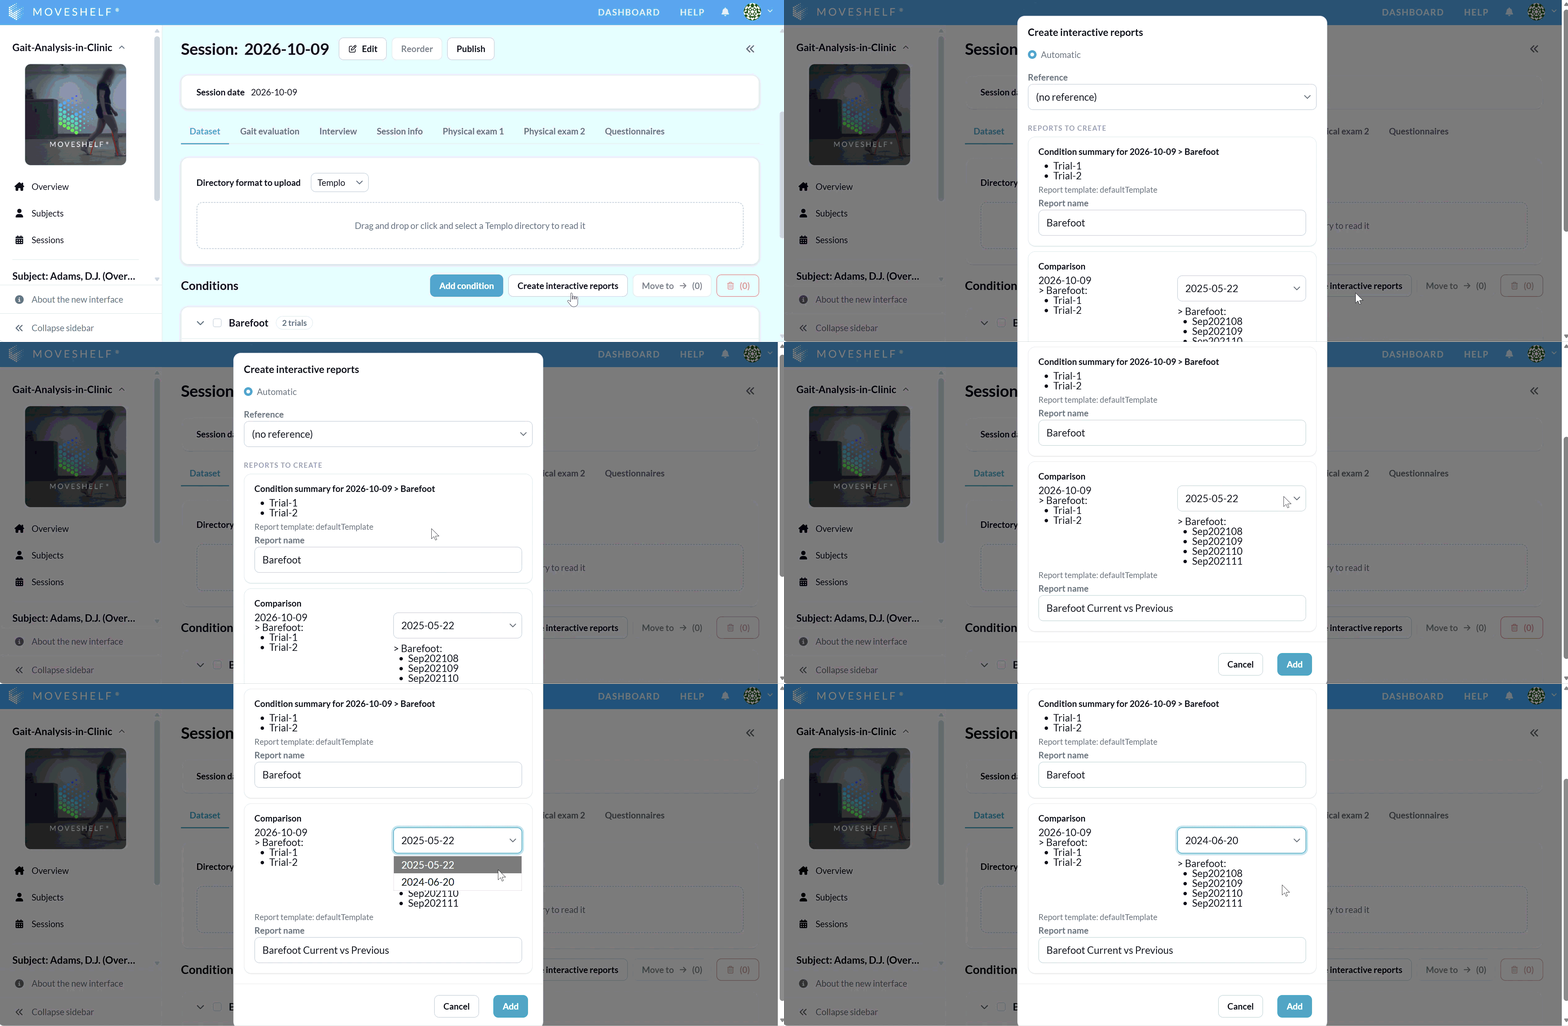
- Click "Create interactive reports" with or without selecting trials/condition.
- If you select no data, all data from all sessions will be included and a list with a predefined set of reports will be displayed.
- If you selected trials/conditions: select the "Automatic" option (see gif below).
- Only if no data was selected and multiple previous sessions are available: If you are creating a session comparison report, use the dropdown to choose which previous session to include in the session comparison report.
- You can add Reference data to the reports. Note that this will be applied to all reports you're creating in this workflow.
- Rename the reports if necessary.
- Click 'Add' to create the report(s). The report(s) will be placed within the session from which you initiated the creation of the report(s).
 There is a maximum amount of characters allowed for the name of a report. If the name is too long, you are notified by an error message stating this information.
Adding reference data and other adjustments can also be done by going into editing mode within your report (open your report and click the 'Edit' button, see section Edit report).
There is a maximum amount of characters allowed for the name of a report. If the name is too long, you are notified by an error message stating this information.
Adding reference data and other adjustments can also be done by going into editing mode within your report (open your report and click the 'Edit' button, see section Edit report).
Edit report
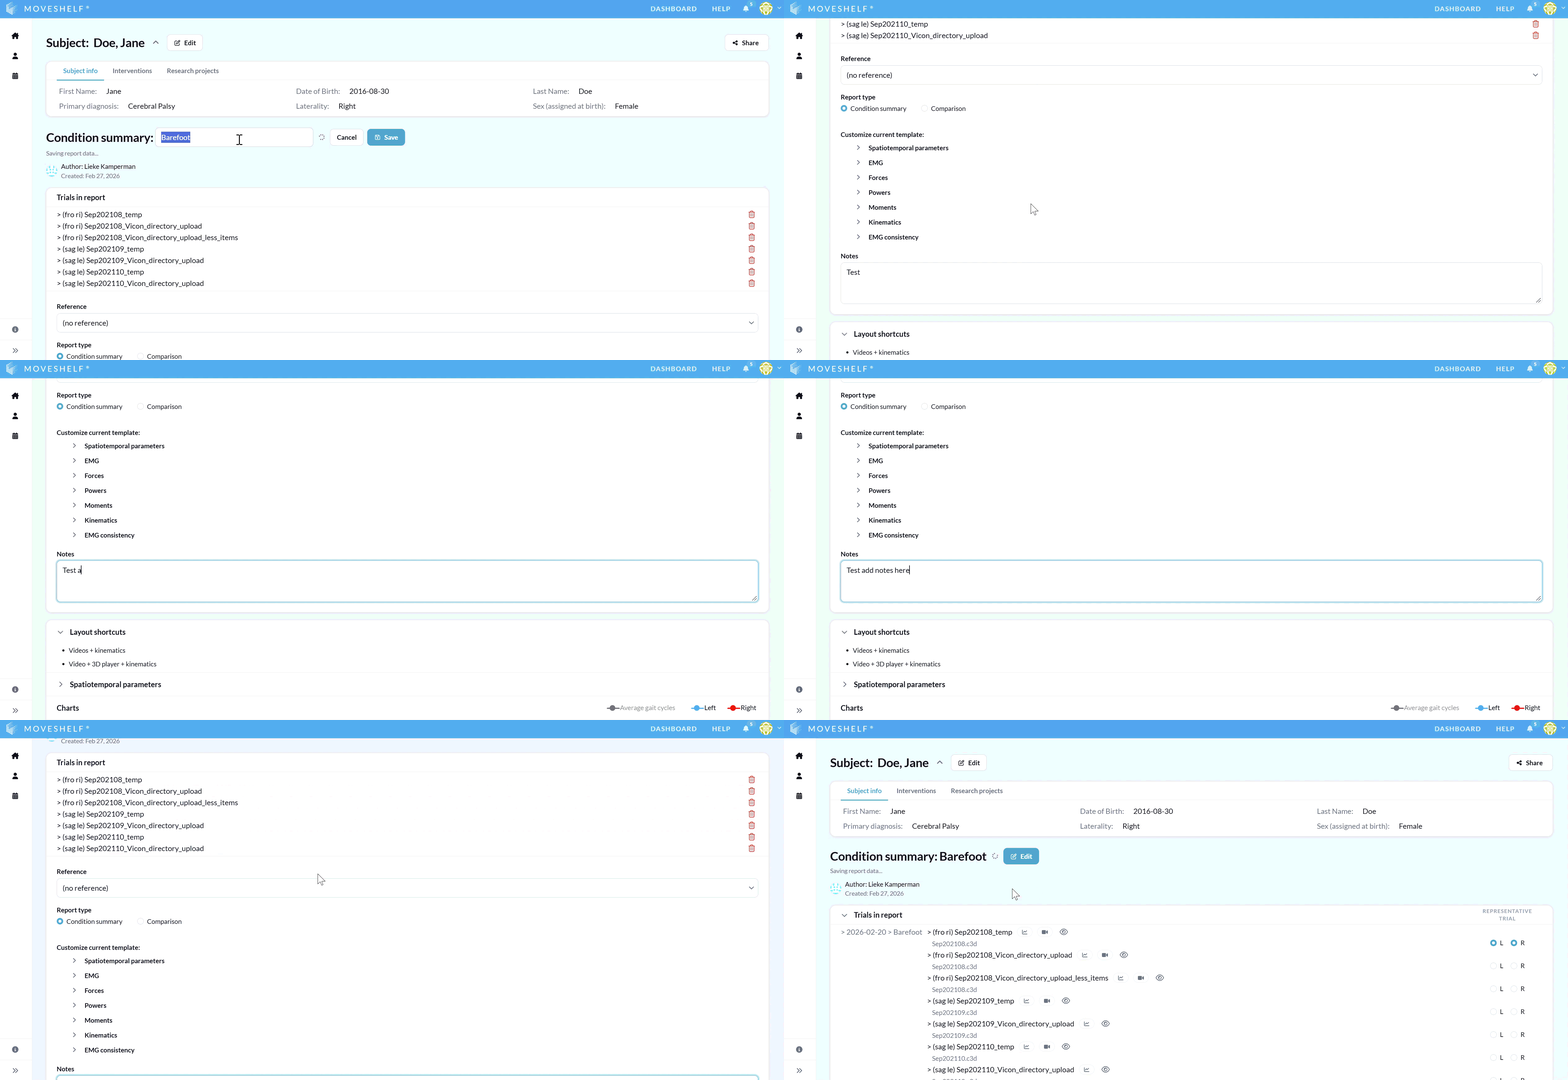
Find your report within the session in the navigation menu, the subject home page, or the session home page, and click on ‘Edit’ to go into editing mode of your report (see image below). You will be able to enrich or make changes in the visualization of your report. Make sure to click ‘Save’ after changing anything in your report.
Any of these edits will only affect your current report. If you'd like to change your default report layout, please contact Moveshelf support. Edit report name
On top in the editing mode you can change the name of your report. Please note that the report name has a limited amount of characters you can use. If the name is too long, you are notified by an error message stating this information.
Edit reference data
Use the dropdown under the header ‘References’ to add or change reference data in your report (see Reference data for more information).
Change report type
Change the way your data is represented by switching between a ‘Comparison’ and a ‘Condition Summary’. More information about the difference between these two types is given in the section above, Create report.
Change report template
Your project can have a configuration that defines your default report visualization, including which graphs are shown and hidden. When you have different workflows in which you require the visualization of different subsets of data, this is where you can switch between your predefined additional report templates. More information about report templates can be found in section Additional report template.
Customize your current template
At the bottom of the edit options there is a possibility to (de)select spatiotemporal parameters and graphs to create a concise overview of a report to show to a clinician.
Add notes
Under the header ‘Notes’ there is a text field where you can leave notes in your report.
Update report visualization
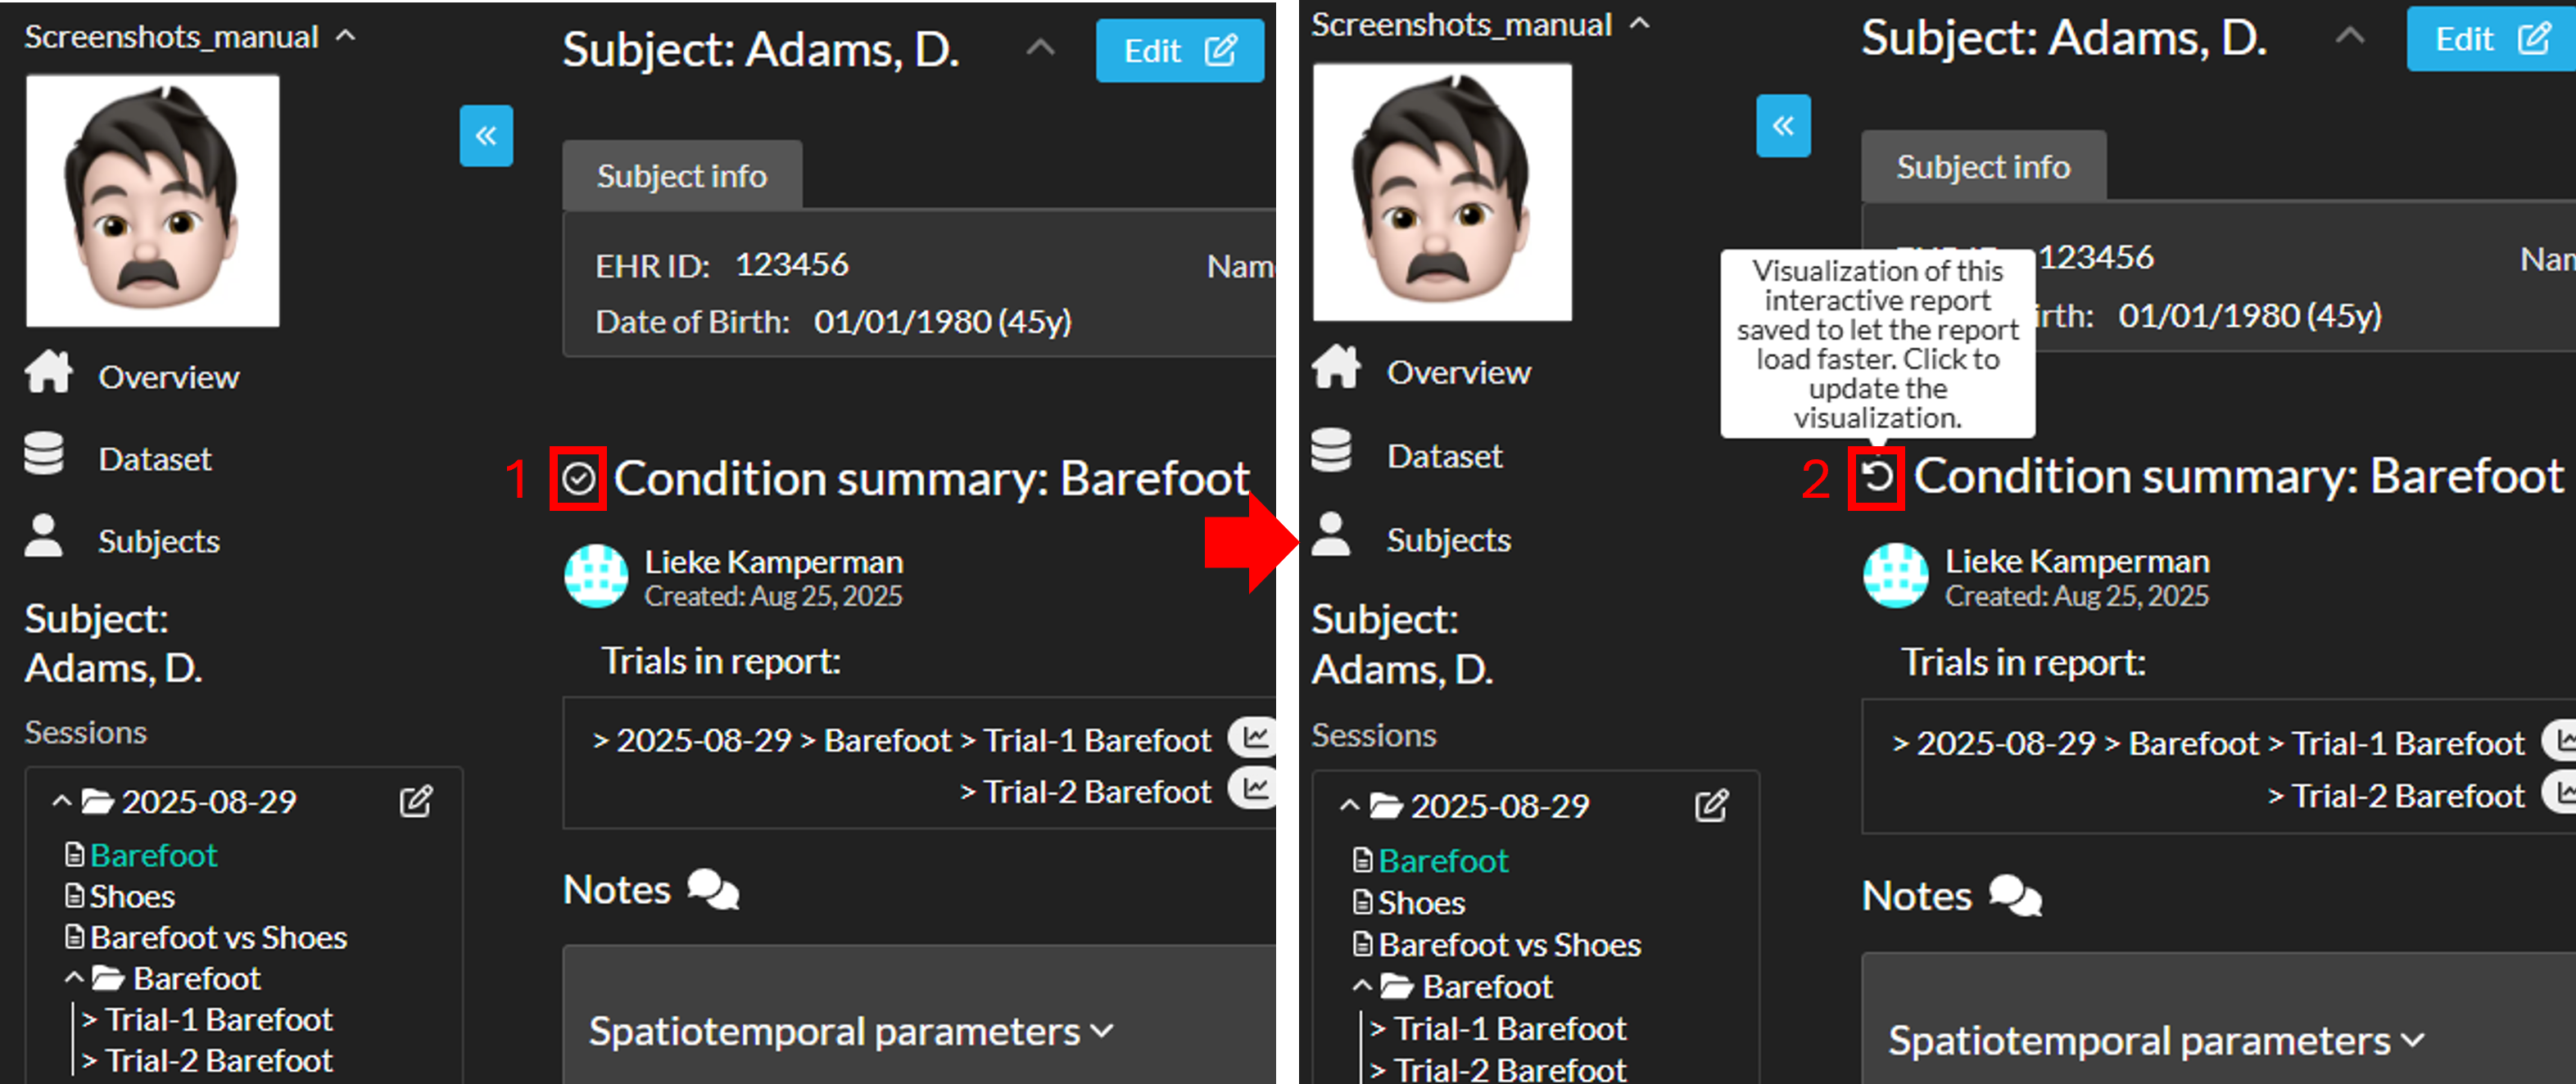
To update the report visualization:
- Hover over the checkmark icon next to the report title.
- The checkmark icon will change to a refresh icon. Click the refresh icon to update the visualization.
Delete report
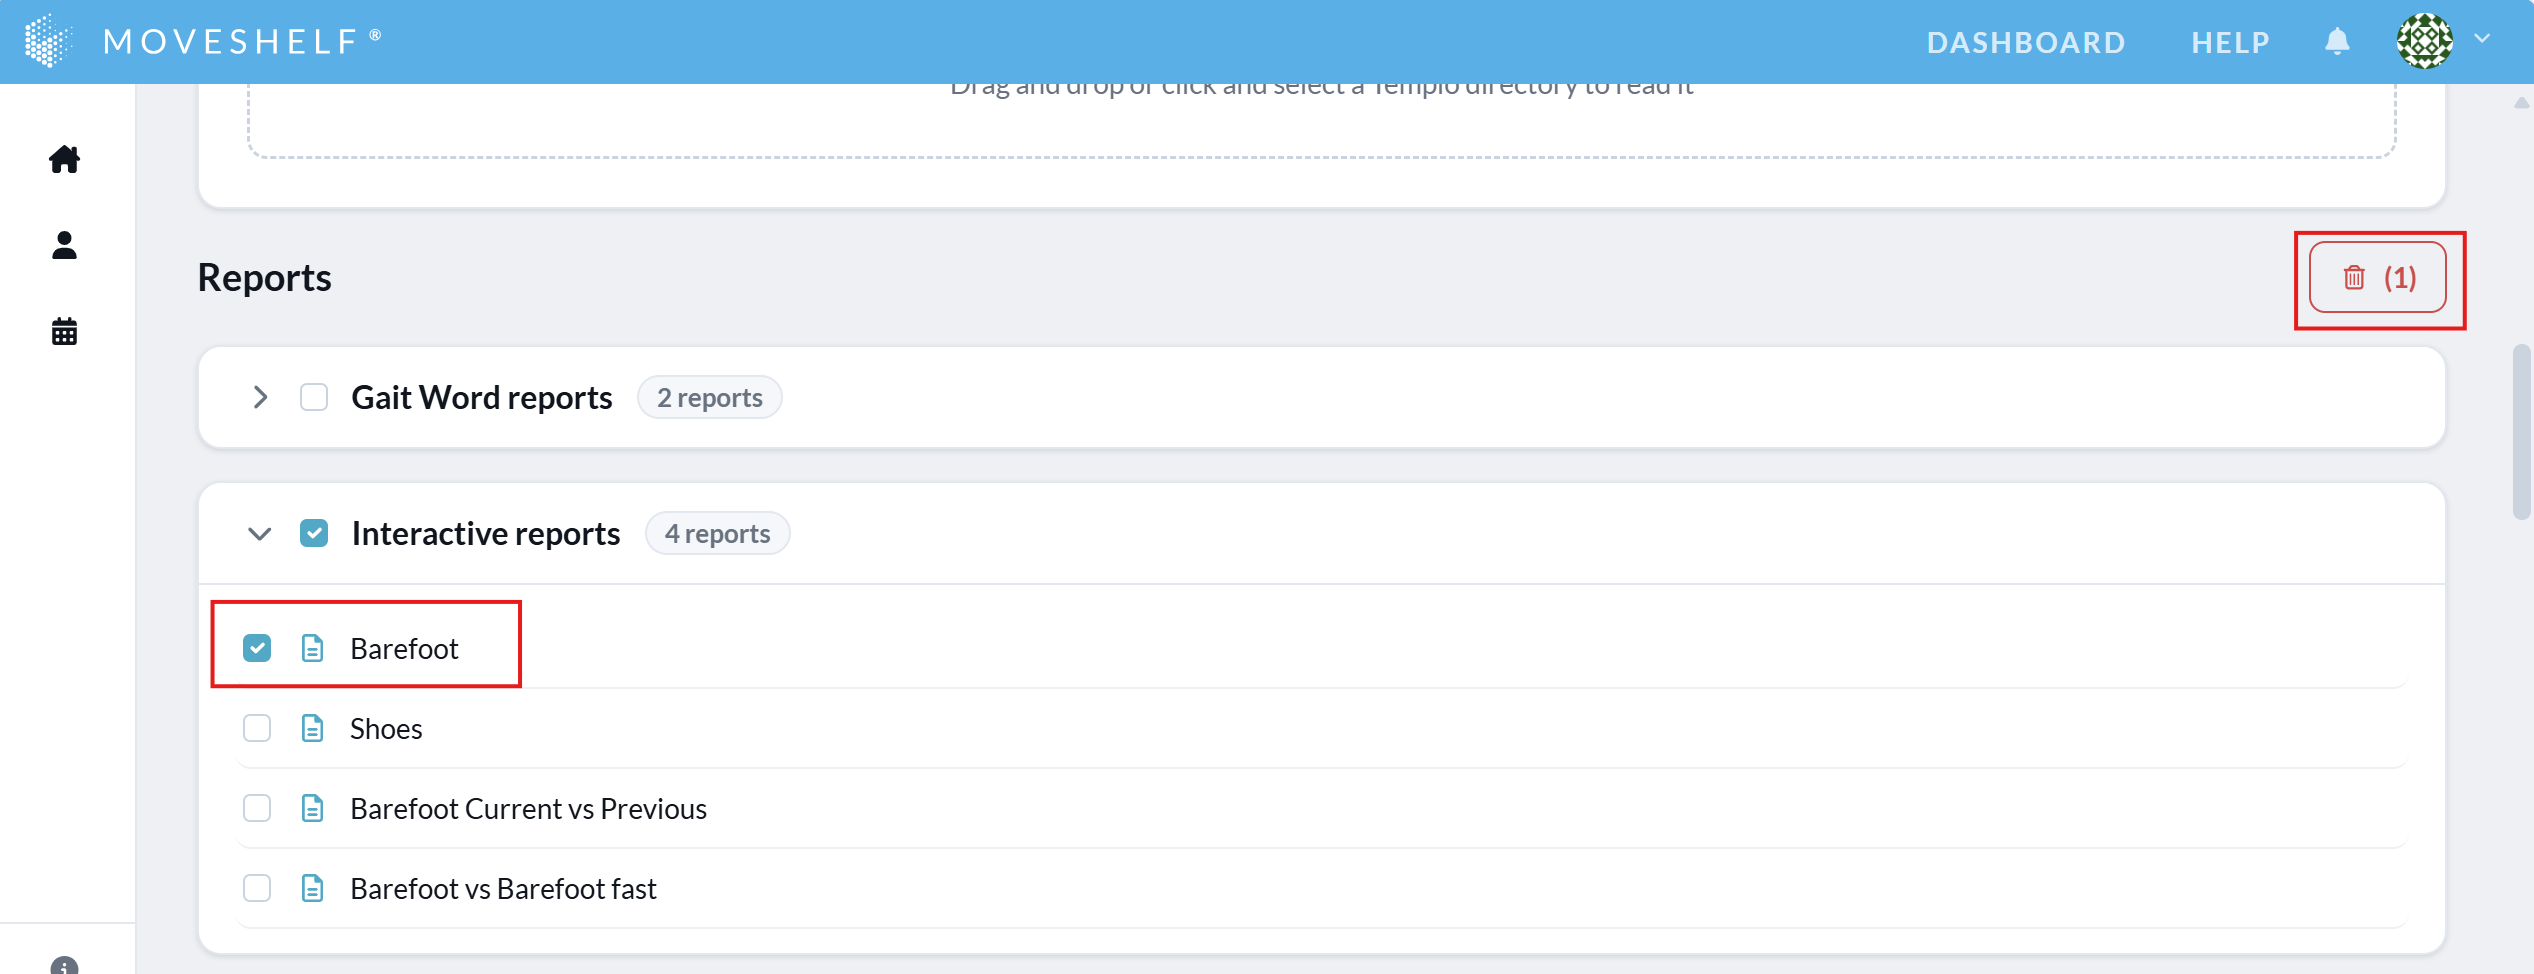
- Select the report(s) you want to delete.
- Click on the recycle bin icon to delete the selected report(s).
Reference data
Reference data is based on (a selection of) your own data. It is possible to have multiple reference datasets in one project, like age grouped or matched by movement disorder. Reference data can be added to the report when creating it (for more information see Create report). Also after creating a report, you can add or change the reference data by using Edit report.
EMG reference data
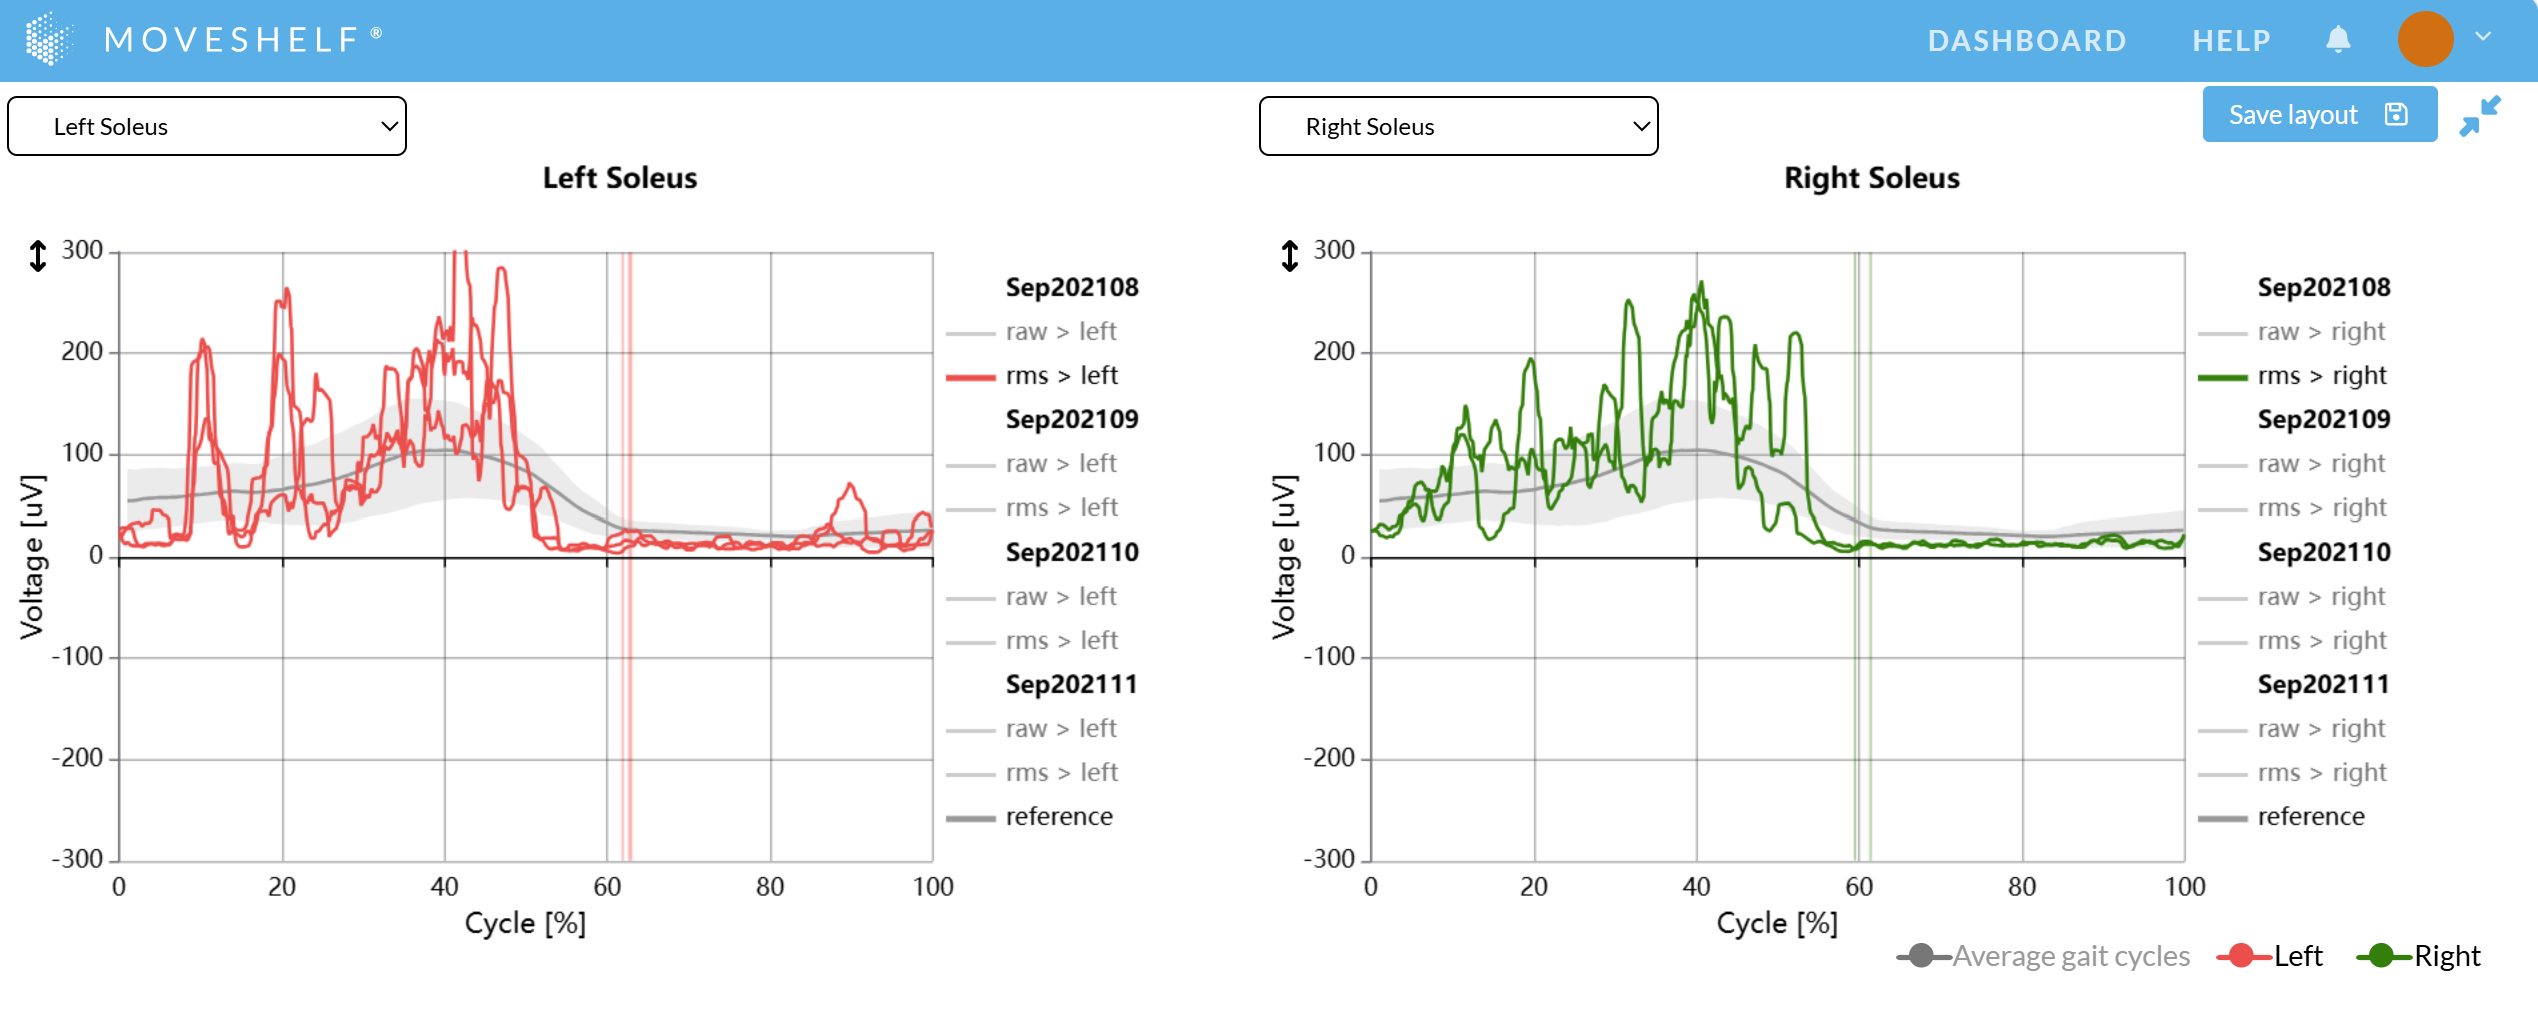
- EMG envelope
You can add your own EMG reference dataset in your Excel file to overlay the data in the EMG graphs on Moveshelf, similar to how we do for kinematics/kinetic graphs (see image below).
- Activation bars
Activation bars display the normal timing of muscle activation at the bottom of the EMG graphs (see image below). You can define the EMG activation bars yourself in the Excel file.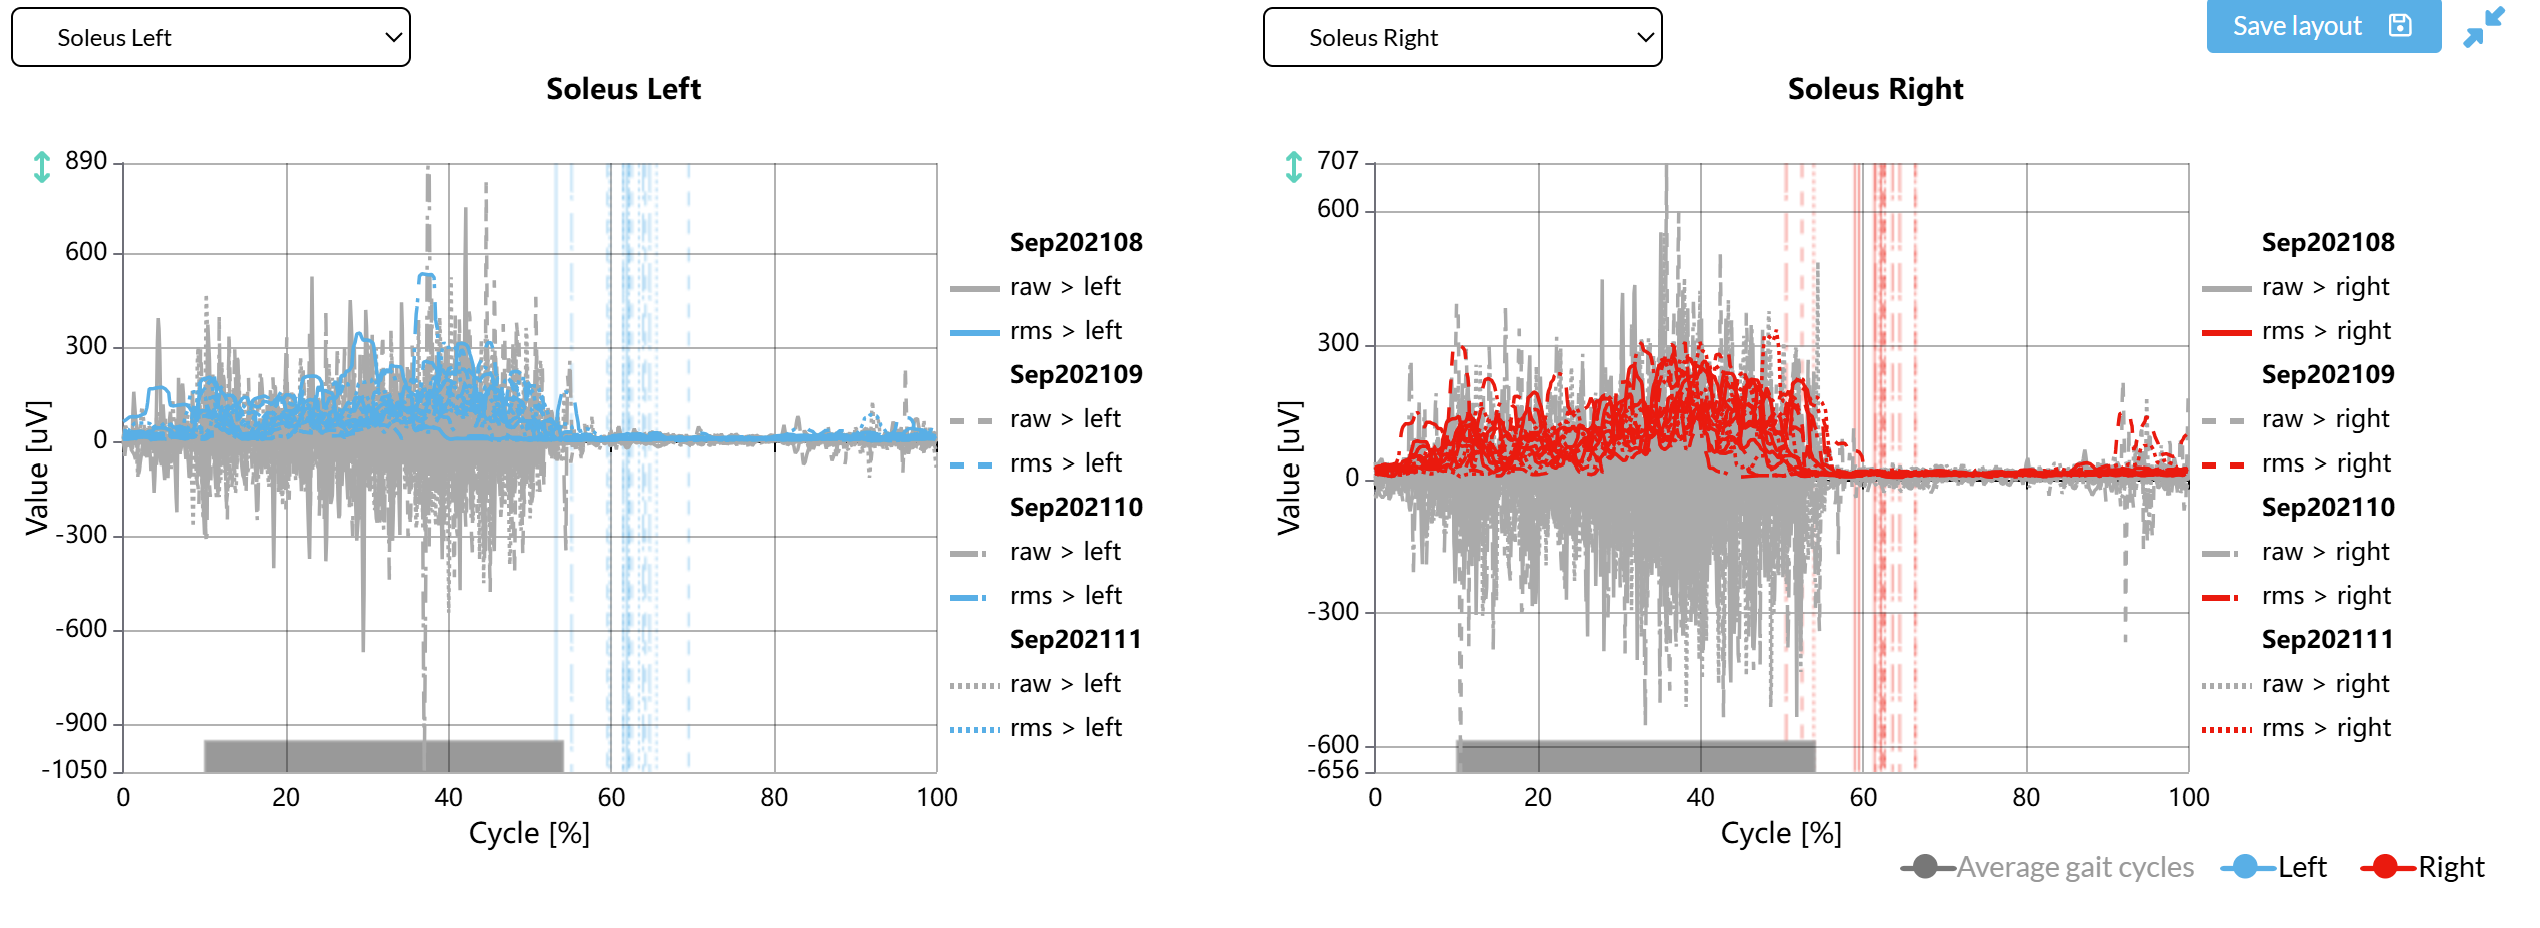
Gait Word reports
This feature is optional and only visible to Enterprise customers with this feature enabled.
- The Physical Therapy Evaluation
- The Quantitative Report
Create the Gait Word reports
To create the Gait Word reports:- Make sure you have created one or multiple report(s) on Moveshelf, as these are used as input for the Gait Word reports.
- Navigate to the Session home page and make sure you're on the Dataset tab.
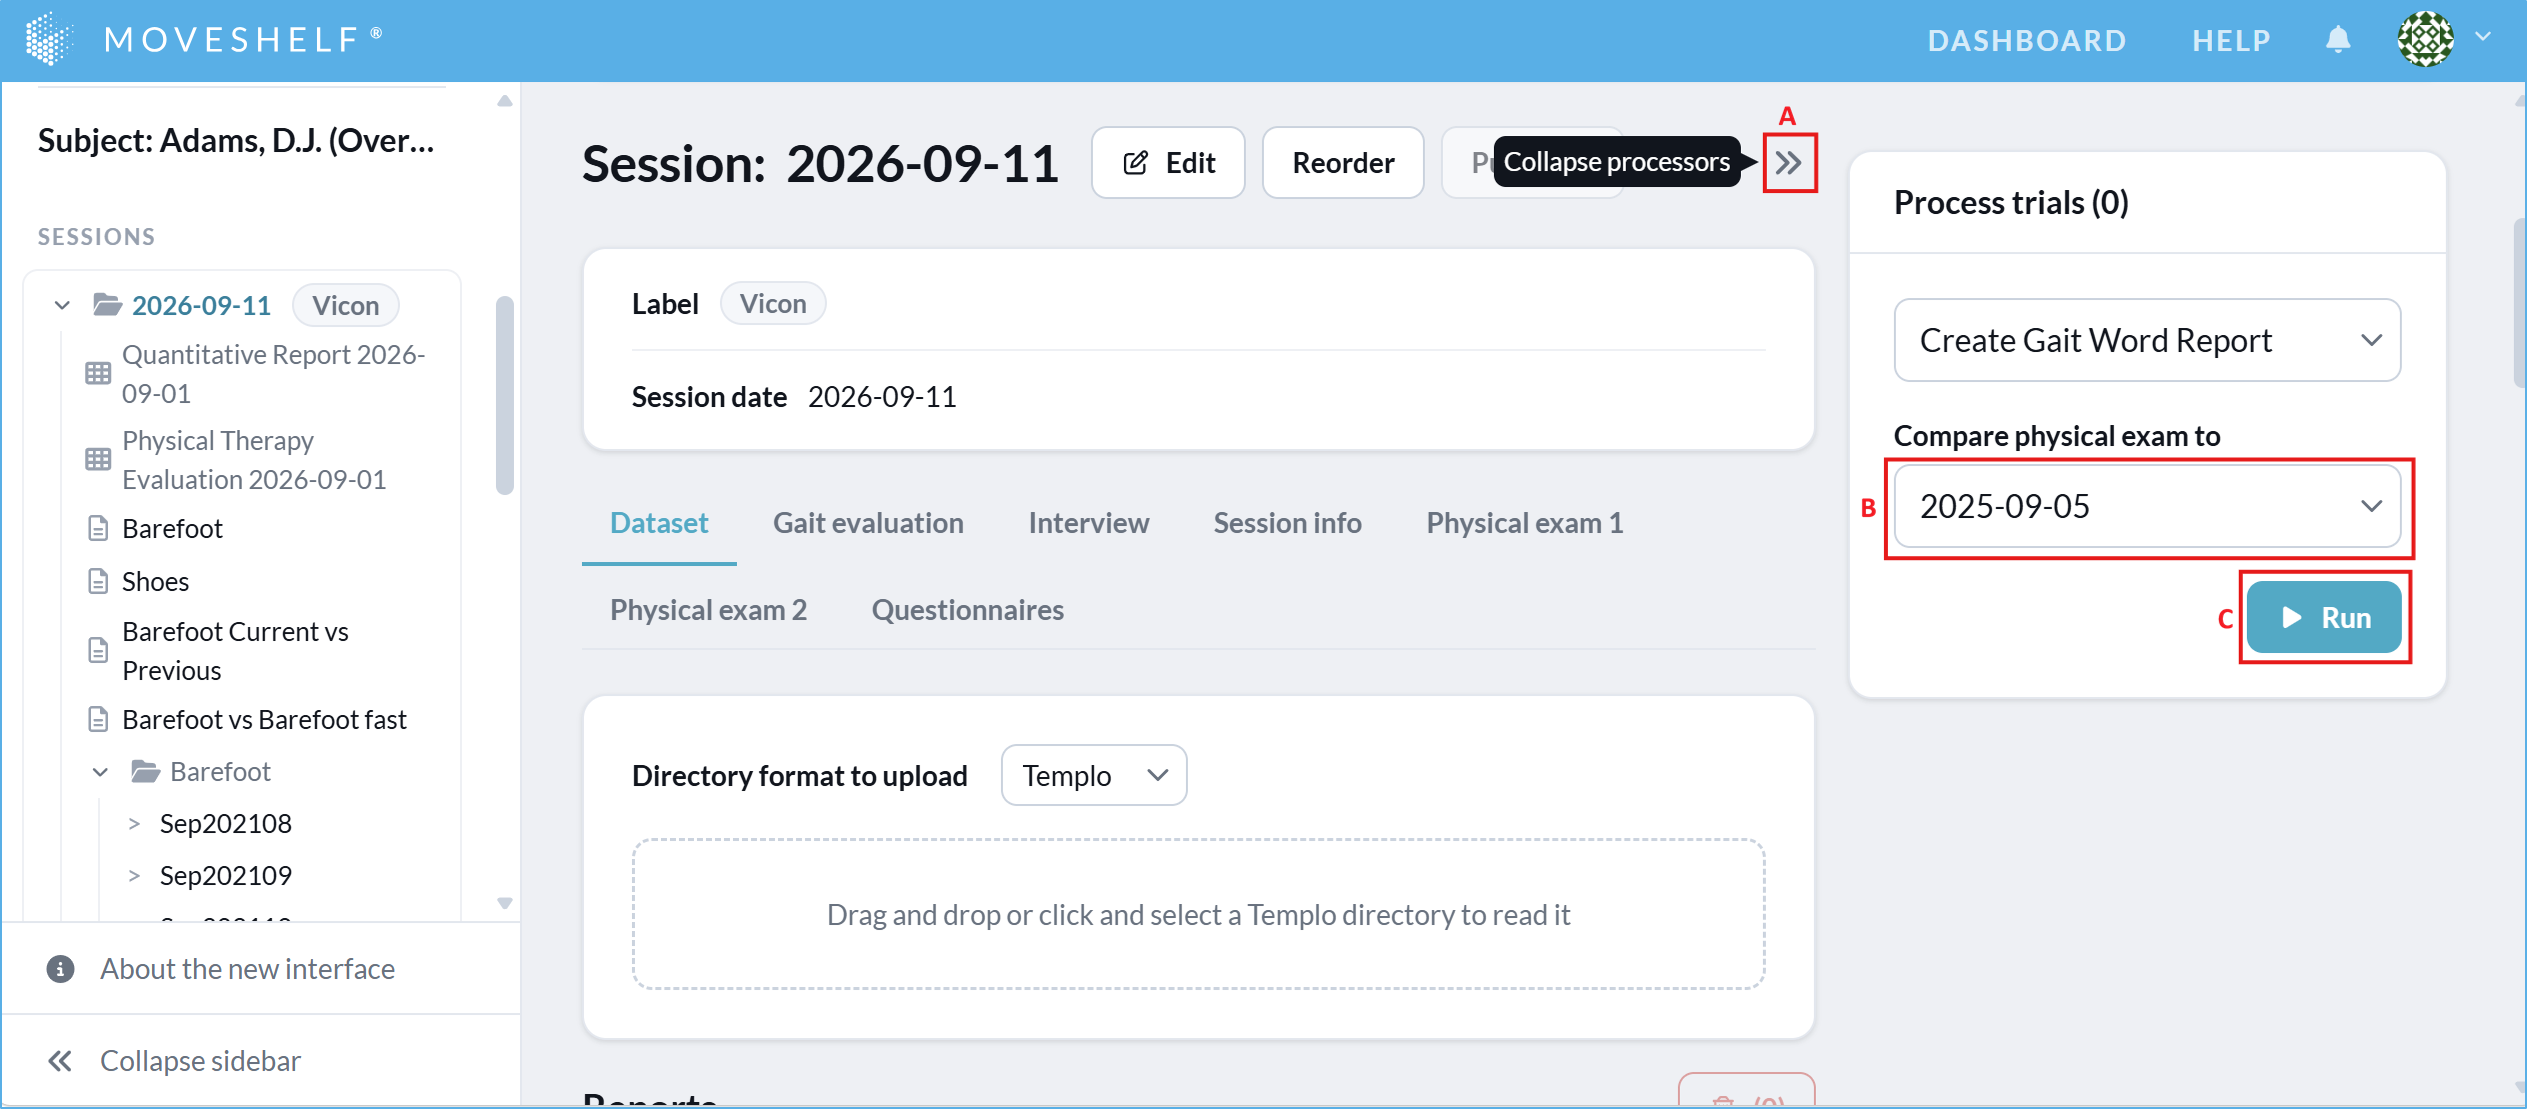
- Open the 'Processors' sidepanel and select 'Create Gait Word Report' (see A in the image below).
- In case multiple previous sessions are available: use the dropdown to select which previous session to include in the physical exam table in the report (see B in the image below).
- Click 'Run' (see C in the image below). The button will change to 'Requesting' with a spinning wheel. Please do not close the Moveshelf page or navigate away on the page until the Word reports appear (and 'Requesting' changes back to 'Run'). Once the reports are visible, you may leave the page, even if the reports are still processing.
Gait Word reports input validation
If specific physical exam values are not formatted correctly, both Gait Word reports cannot be generated. A red error triangle will appear next to the reports in the "Gait Word reports" section (see image below). By clicking on the triangle, an error message detailing which value(s) are incorrectly formatted will be displayed. Once the formatting is corrected, you can retry generating the reports.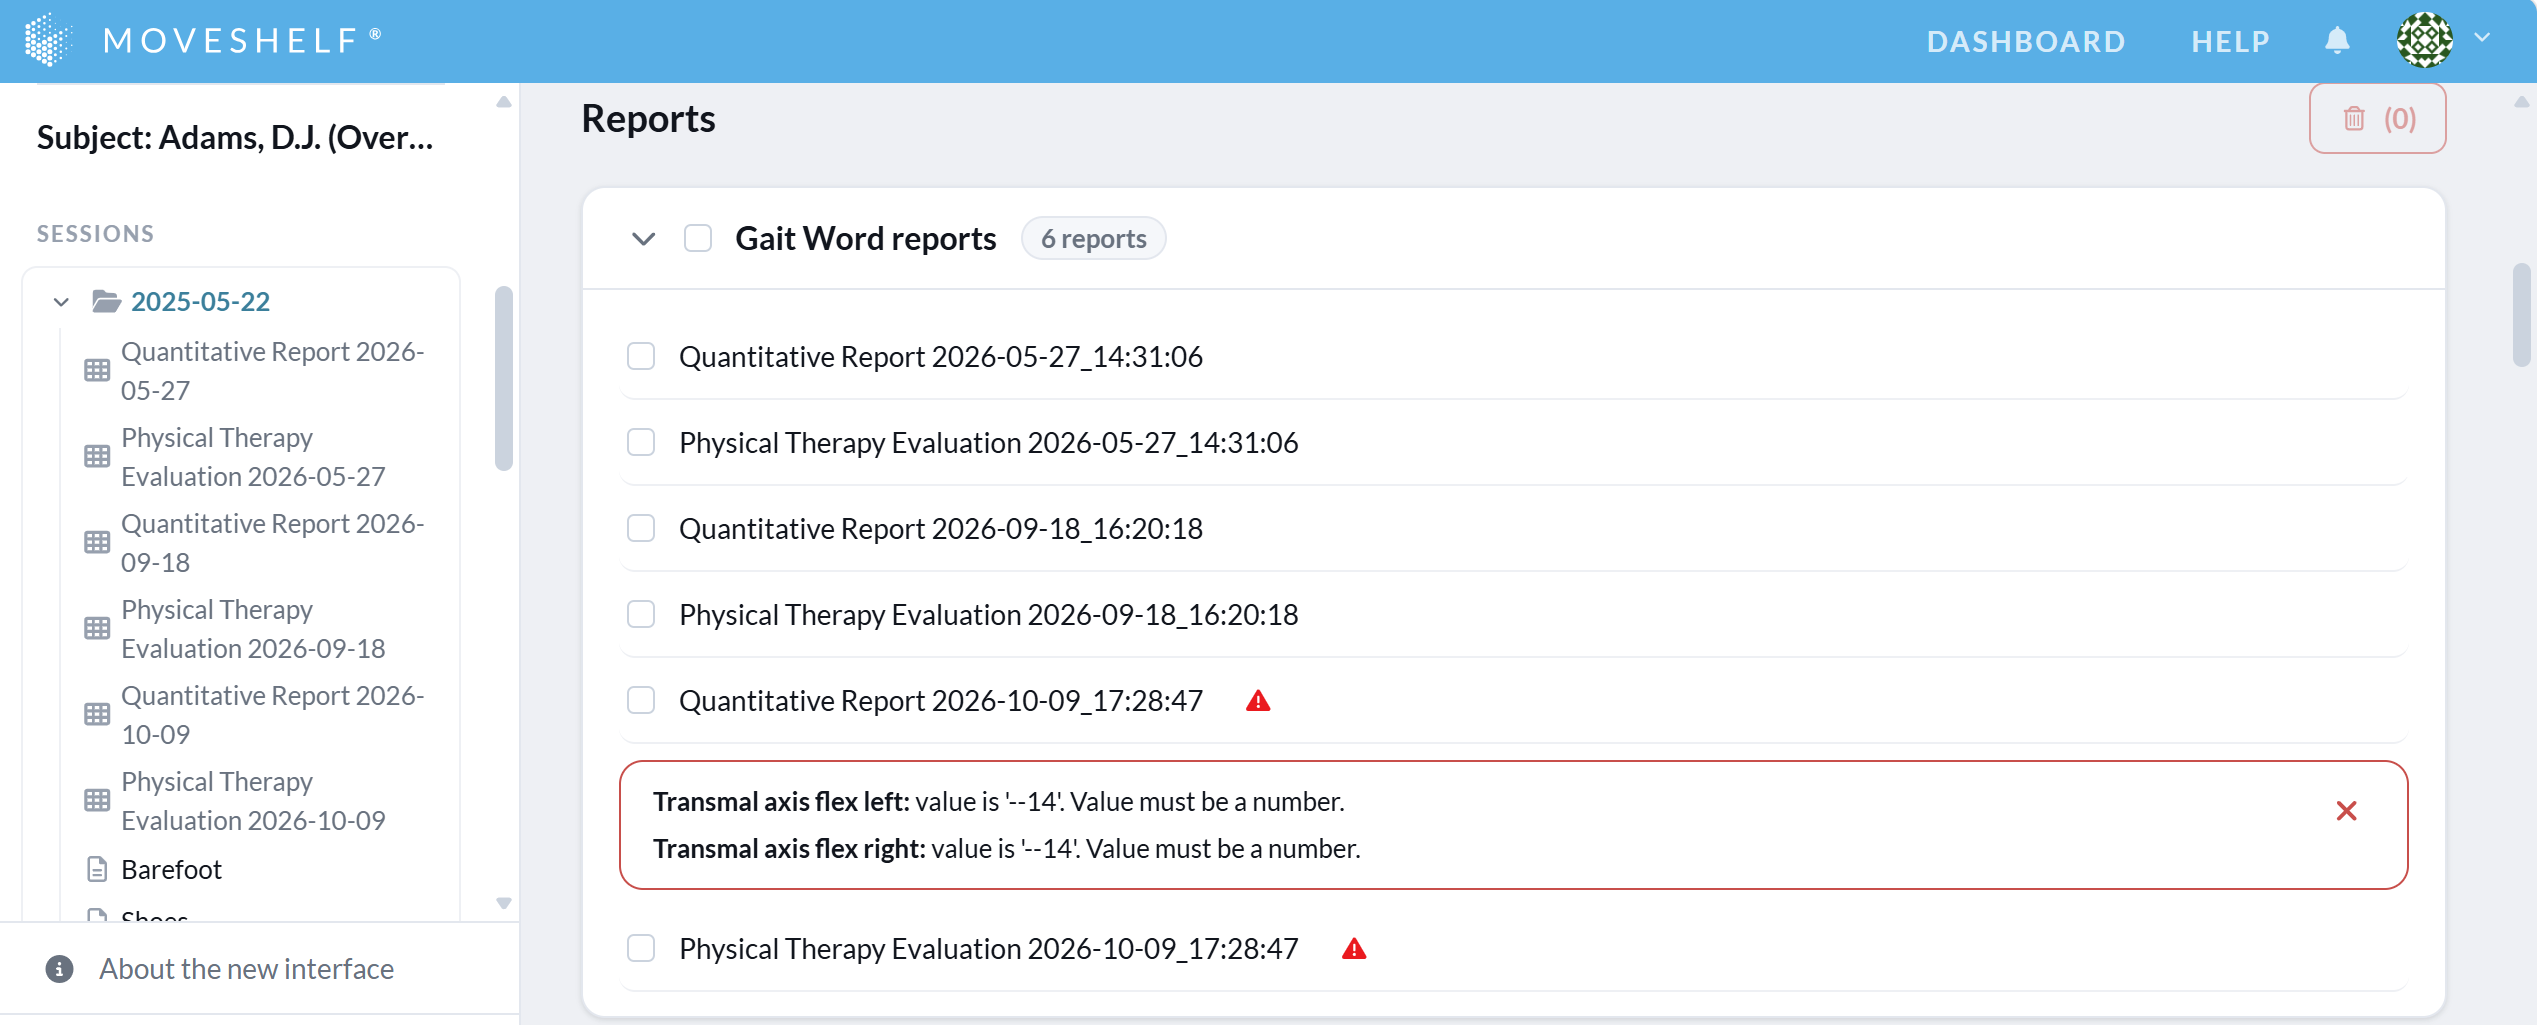
Download the Gait Word reports
You can download the Gait Word reports by clicking on the name, either on the subject homepage, session homepage, or navigation sidepanel.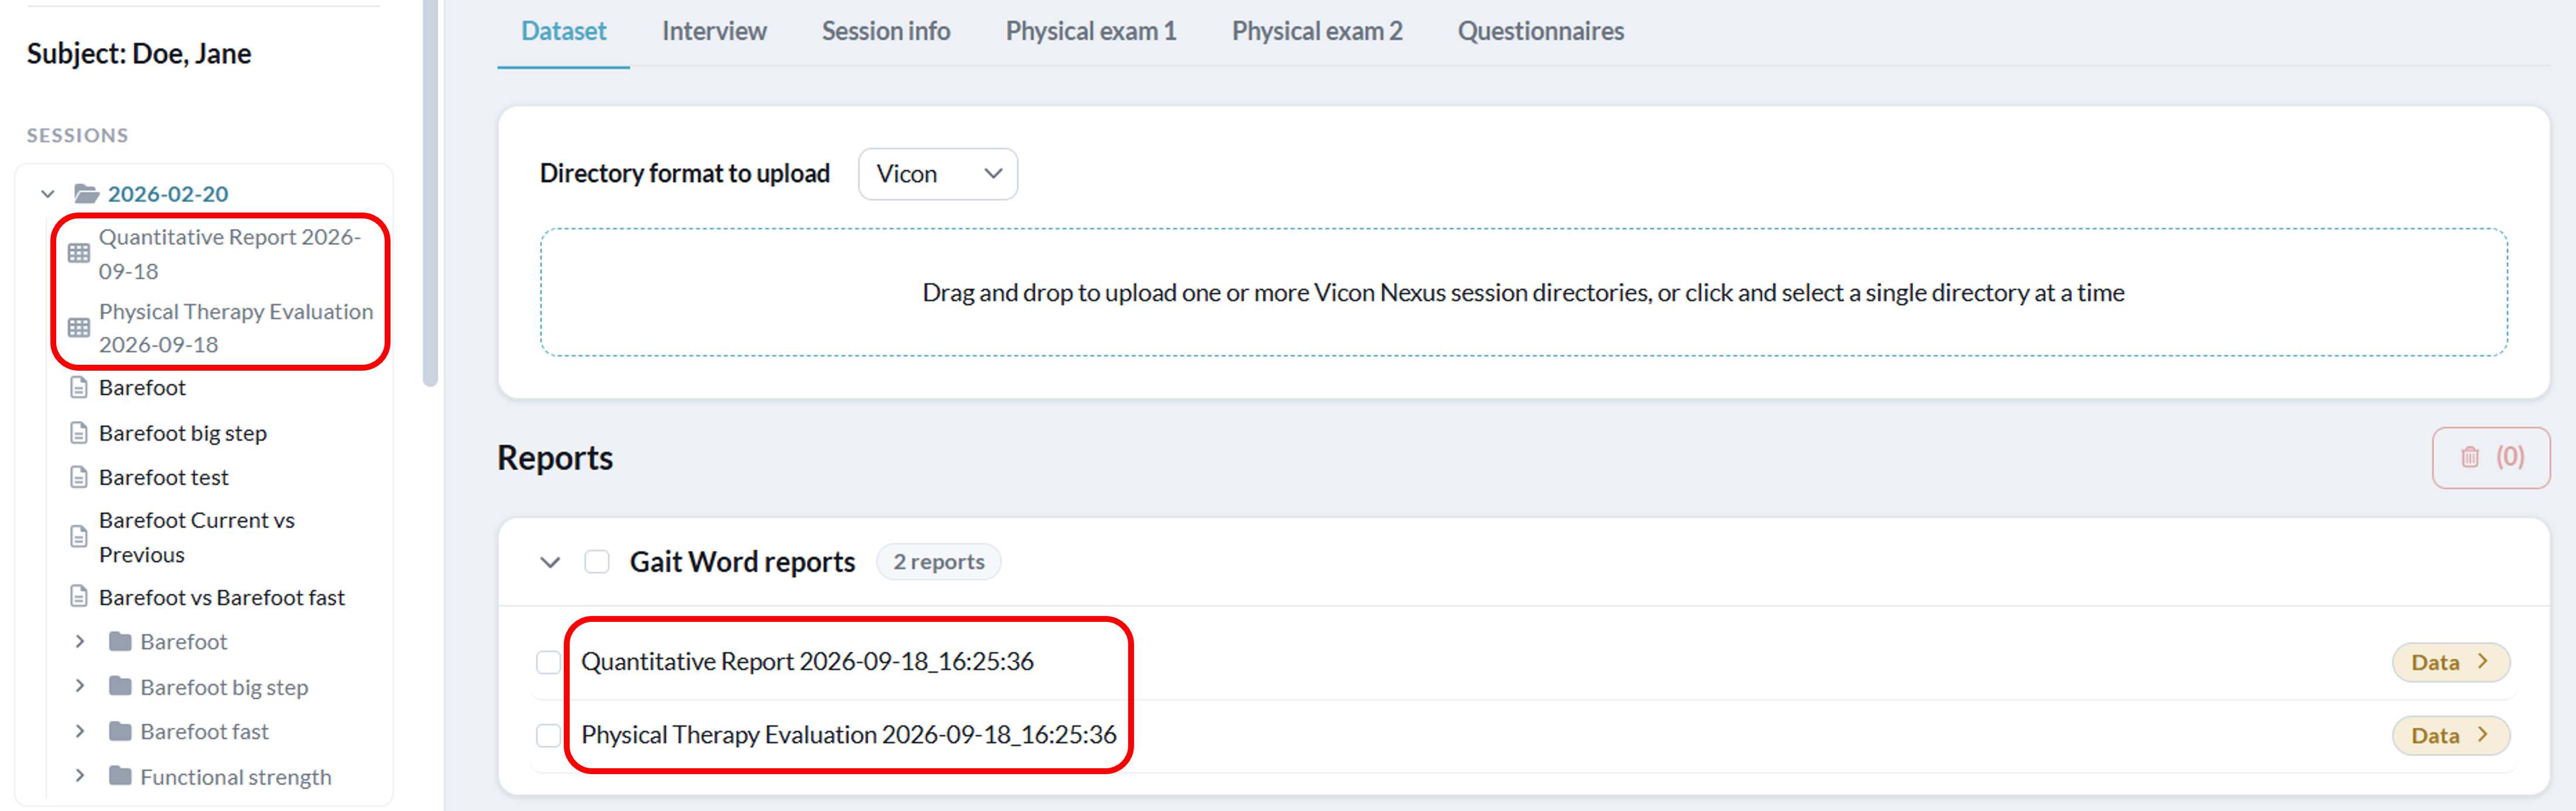
Update the table of contents in Word
The first page of the Quantitative Report contains an empty field for a table of contents. After you have done your preferred edits in the Word document, you can update the table of contents by following these steps:- Right click on the table of contents field
- Select 'Update Field'
- Select 'Update entire table'
- Click 'OK'
Order of Reports in the Quantitative Report
The order of reports in the Quantitative report will follow the order of reports set on Moveshelf. While you can freely reorder reports on Moveshelf, ignoring report types if desired, the Word report will always group reports by type (Condition Summaries, Session Comparisons, and Condition Comparisons). For more information about the default report order and how to reorder reports, see reorganize trials and reports.EMG graphs in the Quantitative Report
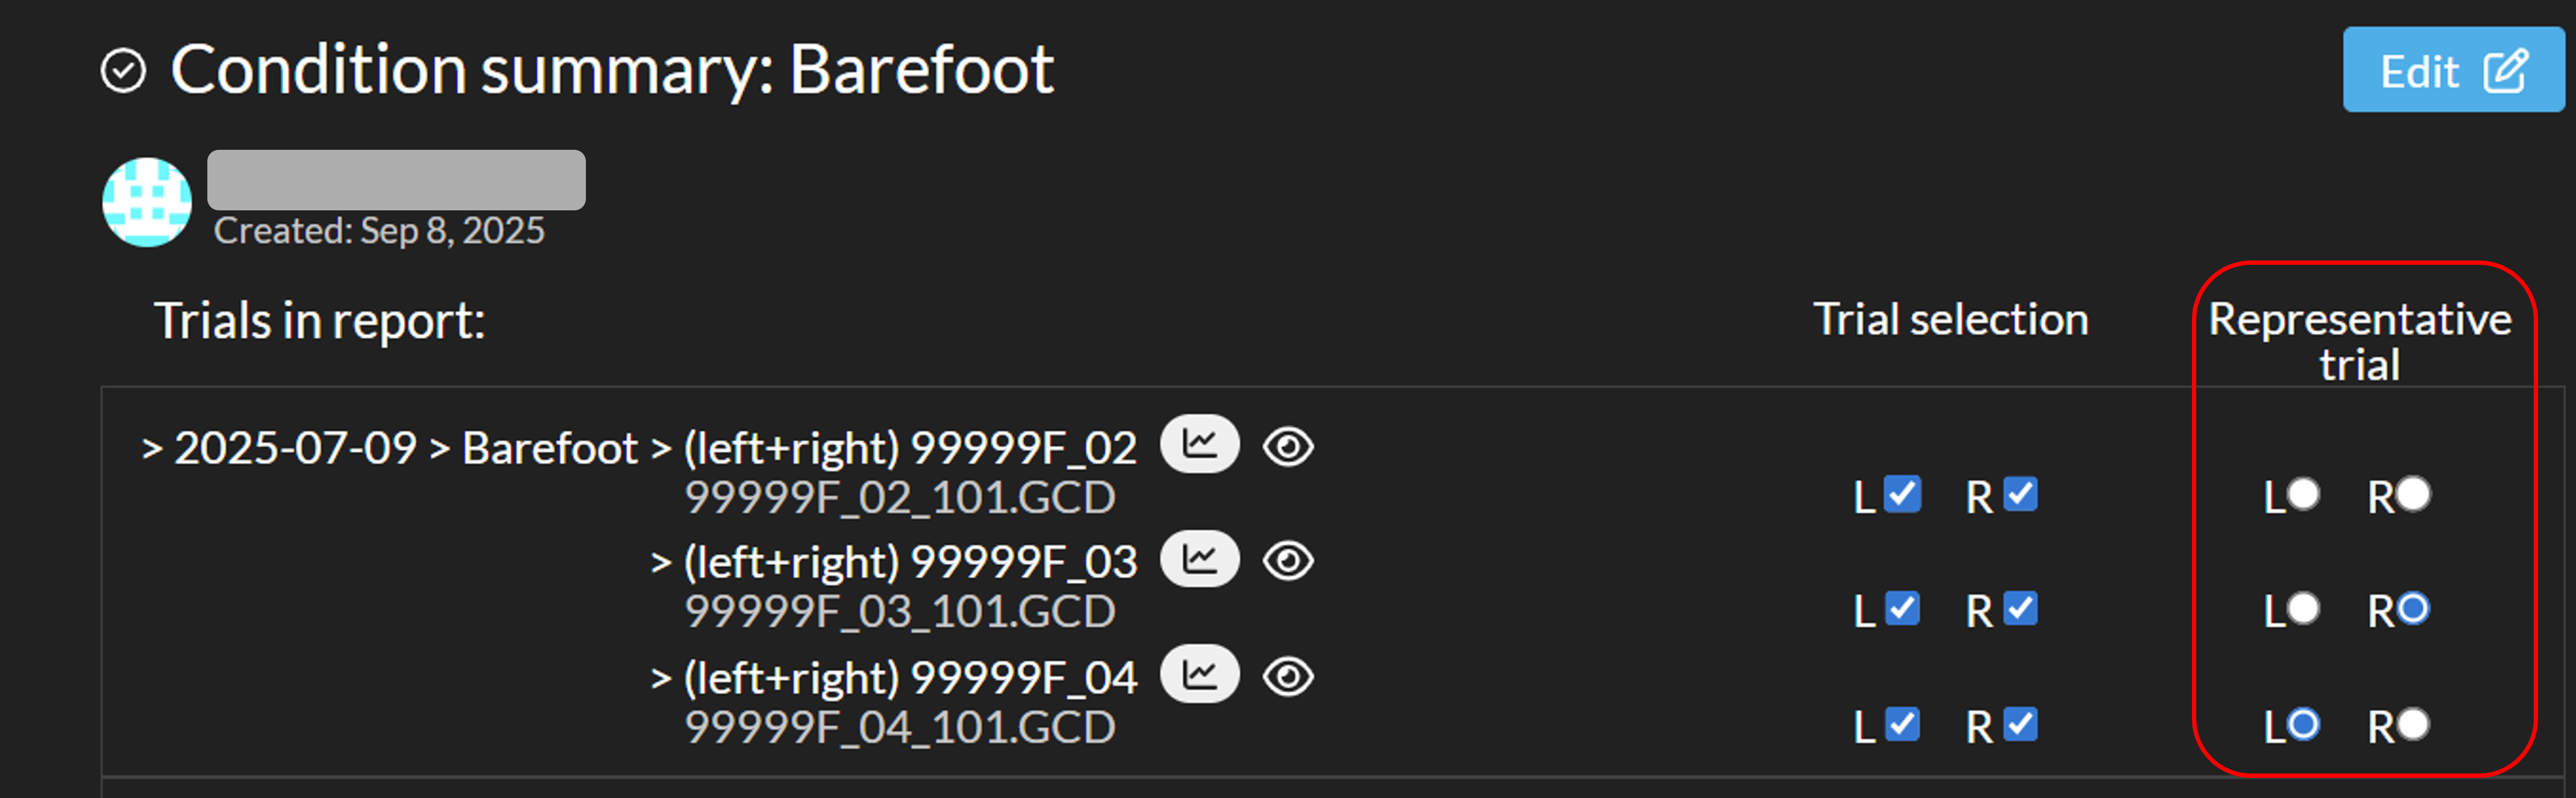
When EMG graphs are available in the interactive reports, they will be included in the Quantitative Word report. You can select one representative trial per side for each condition or session within the interactive report (see image below). This selected trial will be used for the EMG graphs in the Word report. Any changes to the representative trial selection are saved automatically and applied to all corresponding reports.If a trial contains multiple cycles, only the first cycle will be shown. For the EMG consistency plots, the first cycle from the first five trials included in the condition summary report will be shown.
 Note that EMG graphs can be excluded from the Quantitative report by deselecting all 'EMG' options under "Data collected" / "Tests performed" in the "Session info" tab.
Sports Word report
This feature
is optional and only visible to Enterprise customers with this feature enabled.
This report requires a specific measurement protocol, developed by the Motion
Analysis RIG of the the Pediatric Research in Sports Medicine Society
(PRiSM).
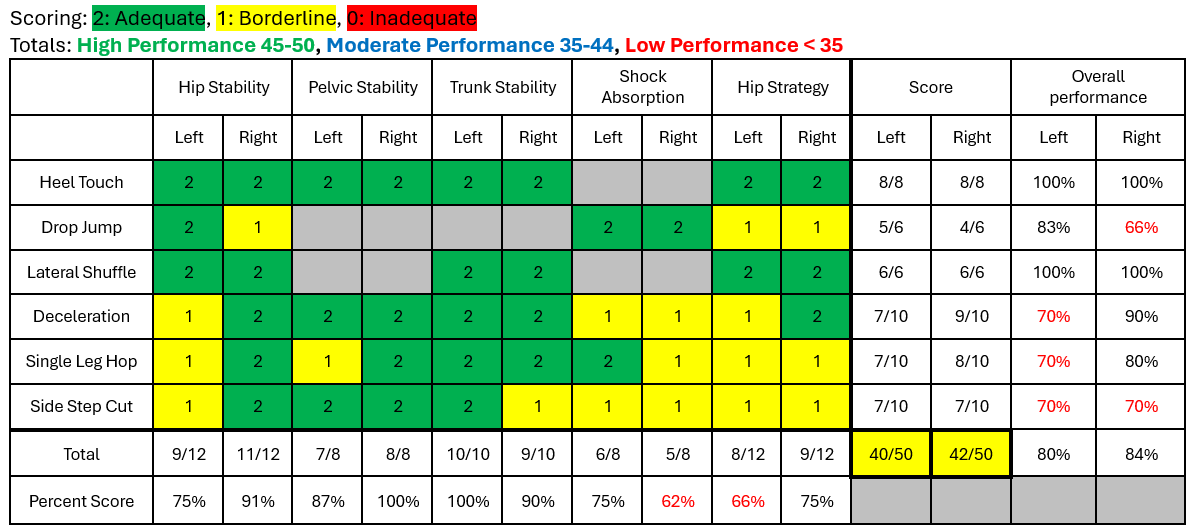
The Sports Word report includes subject information, session information, and a biomechanical evaluation with scoring per activity (e.g. Drop Jump) and indicator (e.g. Hip Stability). See image below for an example biomechanical evaluation summary table.
Sports medicine data requirements
The biomechanical evaluation requires .txt or .gcd files, which are used to generate the Sports Word report.For a complete report left and right data (.txt or .gcd) is required for each of the following conditions:
- Heel Touch
- Drop Jump
- Lateral Shuffle
- Deceleration
- Single Leg Hop
- Side Step Cut
Please note that Moveshelf does not support visualization of .txt files. To enable data visualization on Moveshelf (e.g. graphs), .c3d files can be uploaded in parallel.Create the Sports Word reports
To create the Sports Word reports:- Navigate to the Session home page and make sure you're on the Dataset tab.
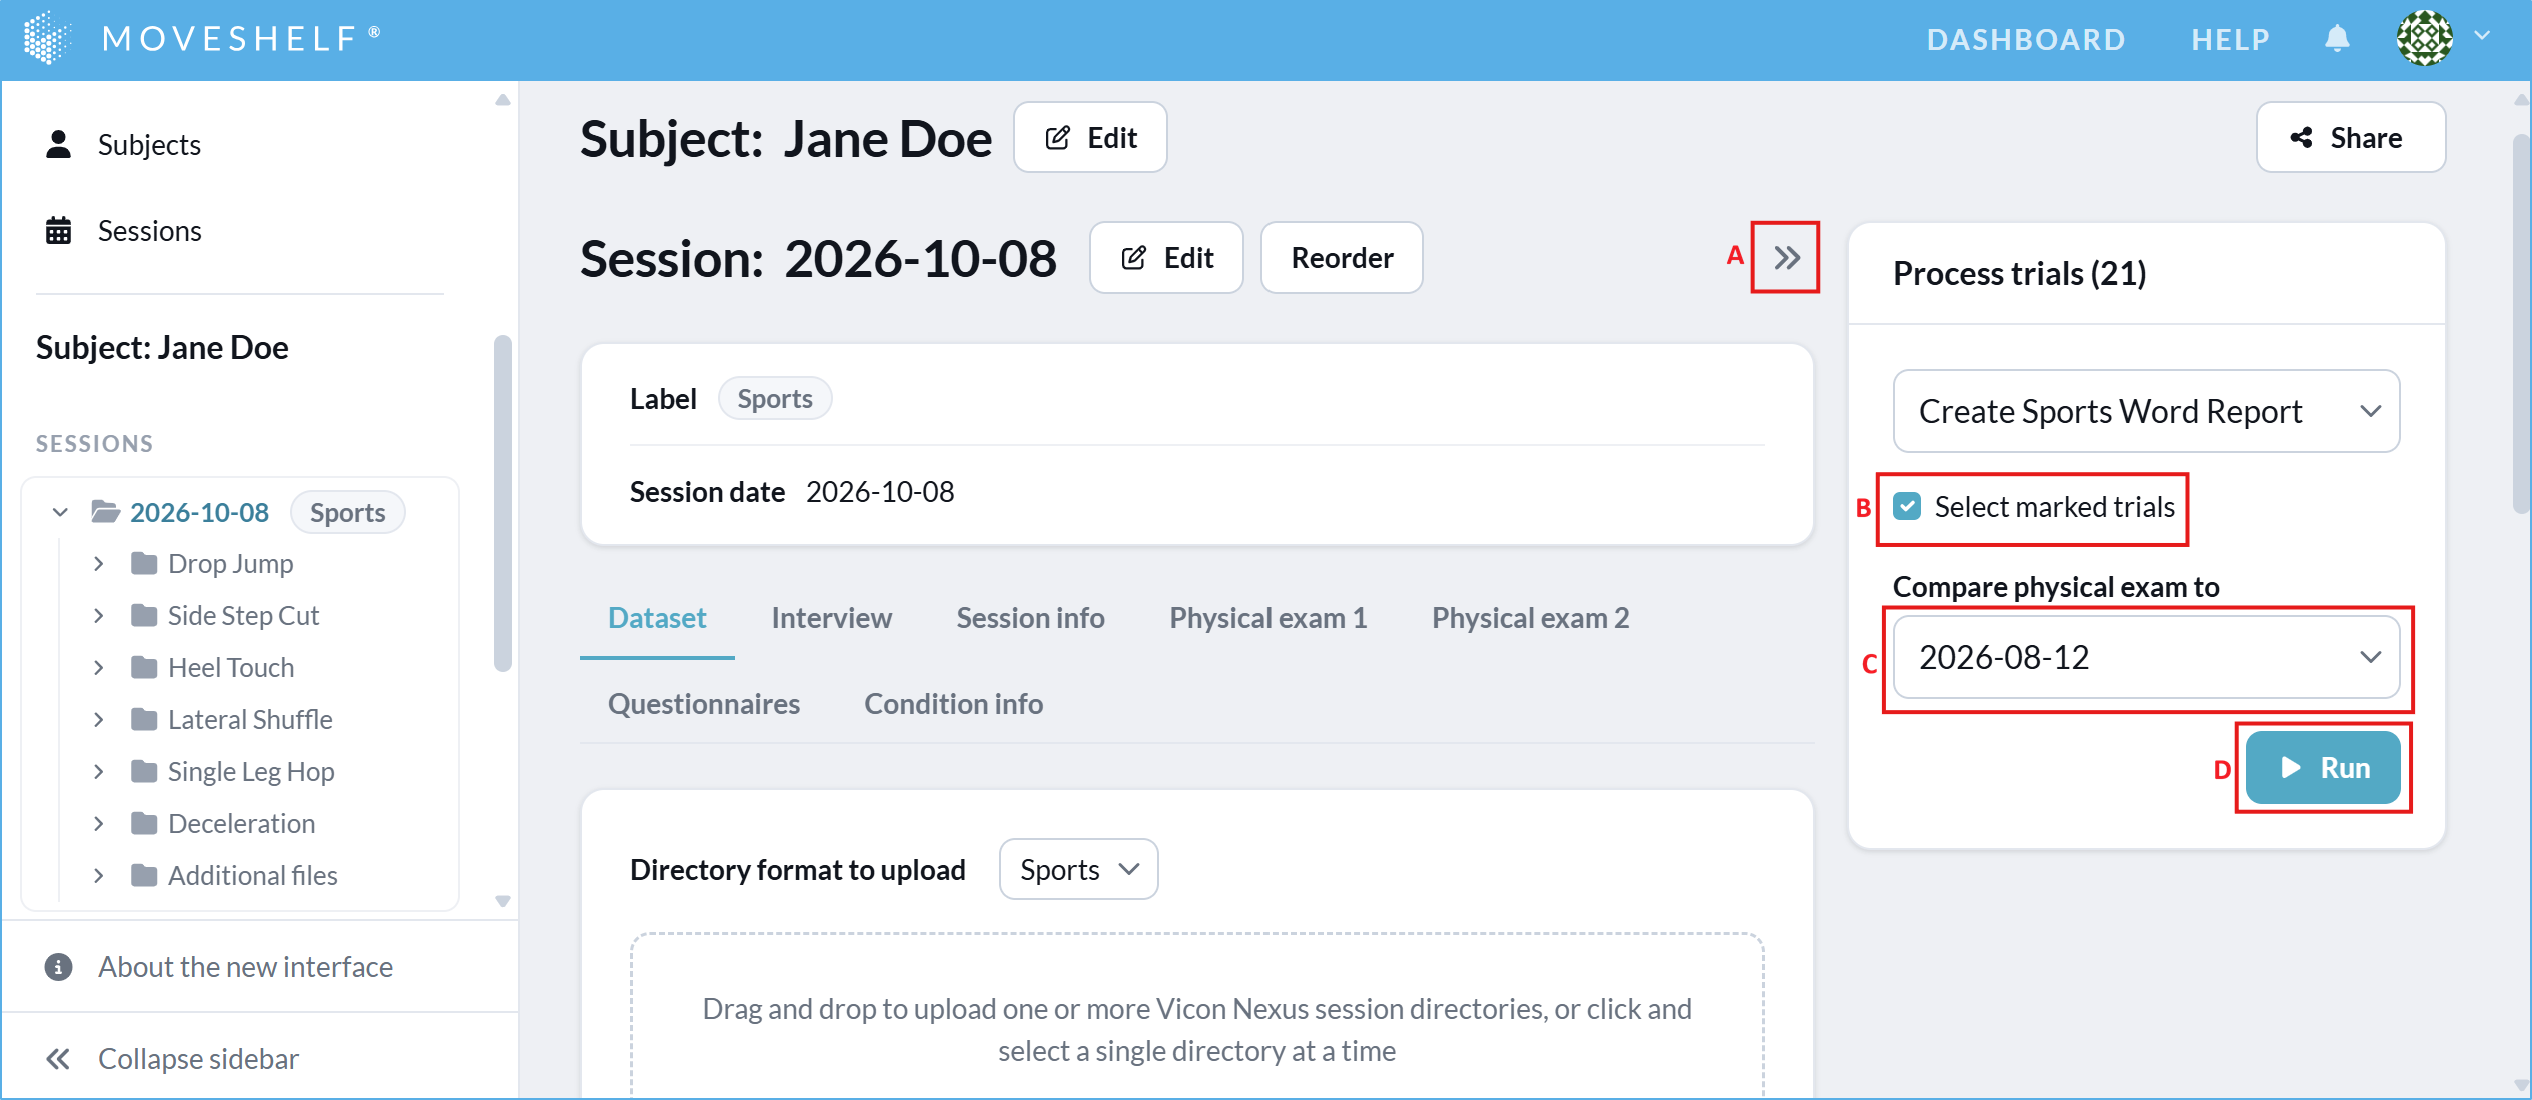
- Open the 'Processors' sidepanel and select 'Create Sports Word Report' (see A in the image below).
- Select the 'Select marked trials' checkbox (B in the image below). This checkbox selects all trials that were marked as 'left', 'right' or 'left + right'.
- In case multiple previous sessions are available: use the dropdown (C in the image below) to select which previous session to include in the physical exam table in the report.
- Click 'Run' (D in the image below). The button will change to 'Requesting' with a spinning wheel. Please do not close the Moveshelf page or navigate away from the page until the Word report appears (and 'Requesting' changes back to 'Run'). Once the report is visible, you may leave the page, even if the report is still processing.
Download the Sports Word report
You can download the Sports Word reports by clicking on the name, either on the subject homepage, session homepage, or navigation sidepanel.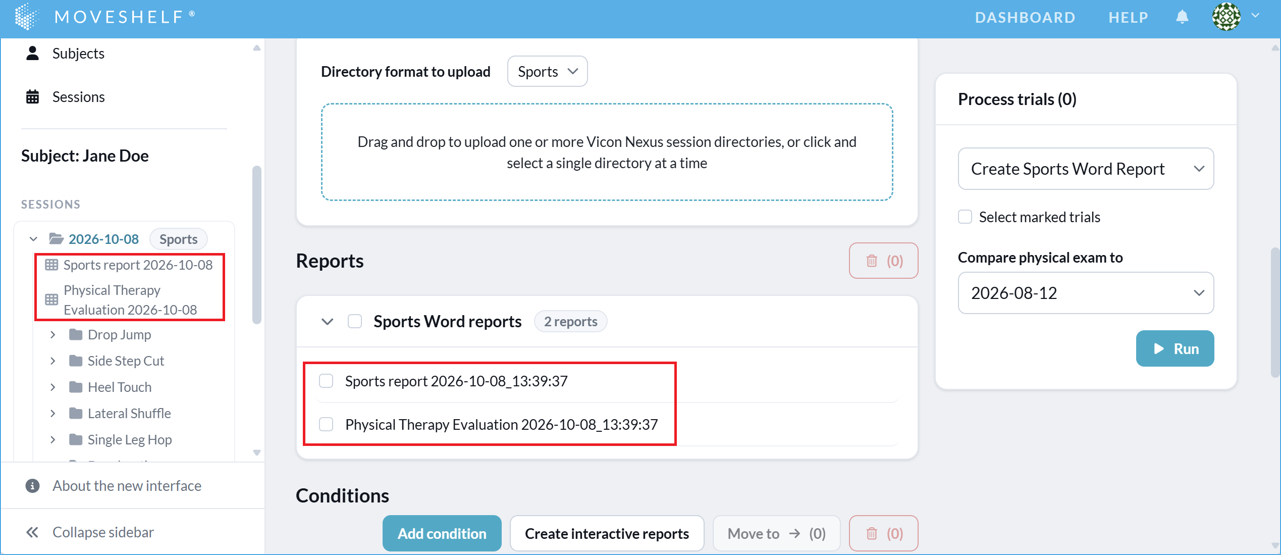
Customize Word reports
This feature is optional and only visible to Enterprise customers with this feature enabled.
Upon request, the Gait Word reports and/ or Sports Word report can be customized according to your wishes. For example, you may want to adjust the header / footer, add subject / session information, add or change text, or adjust which graphs are shown where.
Please follow the following steps to request a change in the Word report:
- On Moveshelf, identify an example of the Word report that you would like to request changes to. Save the link to the session.
- Download the Word report.
- Turn on Track Changes in Word.
- Make the changes that you would like to request.
- Save the Word report.
- Contact Moveshelf support with:
- The link that you noted down in step 1
- The Word report that you saved in step 5.
- Moveshelf support will review the requested changes.
Note that changes in which subject or session information is collected on Moveshelf can be requested following Customize subject / session information.