
 Search Knowledge Base
Projects
Add metadata

Add data
Reports
Below is an overview of the available customizable project settings.
 Please contact Moveshelf support to help you with setting your preferences in your project configuration.
| Setting | Explanation | |
|---|---|---|
| Graph lines & 3D player colors | All graphs & 3D player | Color for left, right, neutral, and reference; applicable to all graphs, timebar events and 3D player. |
| Background color | All graphs | The background of all graphs can be set to either the default dark or a white background. |
| Force normalization | Force graphs | Force plate data can be visualized in absolute values (N), normalized to body weight (%BW) or normalized to body mass (N/kg). These options are only possible if the body mass is correctly provided, see section Vicon directory upload. |
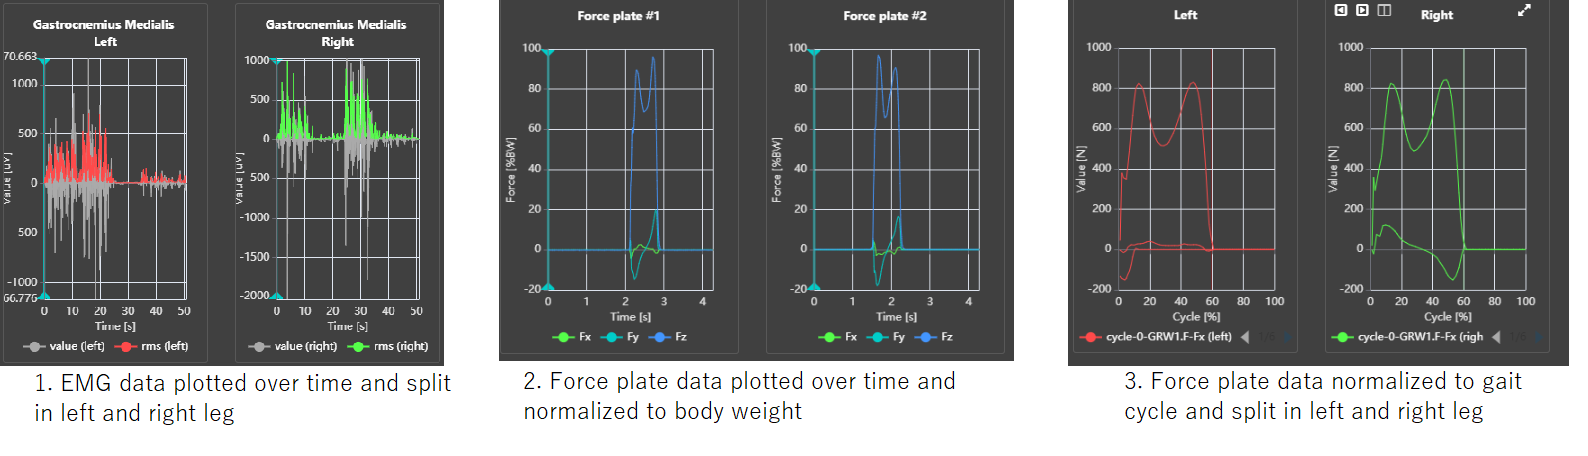
| X-axis normalization | EMG / Force graphs in trials | EMG and force plate data can either be plotted against a time scale (image 1 and image 2) or normalized to gait cycle (image 3). |
| Raw / processed EMG | EMG graphs | Option to show only raw and/or processed EMG. By default both are shown and can also be disabled temporarily by clicking in the graph's legend. See the section EMG processing methods for more information on the different processing methods for C3D data. |
| EMG consistency | Time-based EMG | EMG graphs are shown by default as individual graphs. With an additional setting you can get an EMG graph type which overlays all EMG channels of one leg (e.g., Left) in one 'EMG consistency' graph. This can be useful for analyzing crosstalk and relative timing of activation patterns. See also the section on EMG consistency graphs. |
Report template
By default, these settings apply to all reports, but multiple report templates can be set up within a single project if needed. This allows you to upload divergent versions of your usual data format specifications or apply alternative predefined subsets of graphs to visualize in your reports. More information can be found here: additional report template.
Below is an overview of the available customizable settings, what they apply to, and a brief explanation of each setting.
Please contact Moveshelf support to help you with setting your preferences in your report template. You can specify the desired graph settings using the graph configuration template.| Setting | Explanation | |
|---|---|---|
| Naming | All graphs | Graph names and Y axis labels (e.g. Flexion / Extension). |
| Defined Y-axis limits | All graphs | Fixed Y axis limits can be specified for each graph. When viewing the data on Moveshelf you can then easily switch between fixed limits or automatically-adjusted limits that perfectly fits the data. |
| Show stance-to-swing transition line | All cycle-based graphs | If this setting in enabled, and the gait event 'Foot Off' is detected for all gait cycles in a C3D file, a vertical line is drawn in every cycle-based graph at the transition of stance to swing phase for each detected gait cycle. |
| Additional configurable group of graphs | All graphs | This feature allows you to group any graph together and create a new and customized data header with this content. For example, this feature can create a 'Sagittal overview' with sagittal kinematics, moments and powers for the hip, knee and ankle joints. This new data header shows up on top of the other data, above the data header of e.g. "Kinematics" and can also be selected to open in split screen. |
| Session label filter | All graphs | This feature allows you to show certain graphs only for sessions with a specific session label. For example, this is useful when working with data from multiple labs that require different graph configurations. |
| Subset of graphs | All graphs | Only show a certain subset of graphs as default template in trials and/or reports. For example, this can be of used for hiding a grounding channel for EMG or channels that only contain zeros as a result of restricted degrees of freedom for a joint in its biomechanical model. |
| Subset of spatiotemporal parameters | Reports | Only show a certain subset of spatiotemporal parameters as default template in reports. |
| Left / right separation | EMG / Force graphs | To make the data more organized, EMG and force plate data can be plotted in separate graphs for the left and right leg (see image 1 and image 3 of the section above). |
| Organize EMG graphs per muscle | EMG graphs | This setting organizes EMG graphs by grouping left and right side graphs for each muscle. |
Additional report templates
Please contact Moveshelf support if you would like to setup an additional template for your project. You can specify the desired graph settings using the graph configuration template.With additional reports templates you are able to:
- Apply predefined subsets of graphs to visualize in your reports. This could be useful when you measure data of different populations or pathologies in which you might only analyze certain graphs and/or use only a subset of EMG channels from your default protocol. With an additional report template you can define these subsets as a deviation from your default protocol and visualize only what is relevant by simply applying this template to your report.
- Upload divergent versions of your usual data format specifications. This could be necessary when there is a change in your clinical protocol that results in different names of certain channels. Example: you might start to use different names for EMG channels. These different names could cause Moveshelf to not recognize them anymore and no graphs will be shown for these channels. By specifying these names in an additional report template you will be able to work with data from your previous and new/alternative protocol.
To change from your default report template to an additional one, choose one of the alternative report templates while creating a report, or by editing an already created report and choose a template in 'Report template', see also Edit report.
Edit data selection per cycle
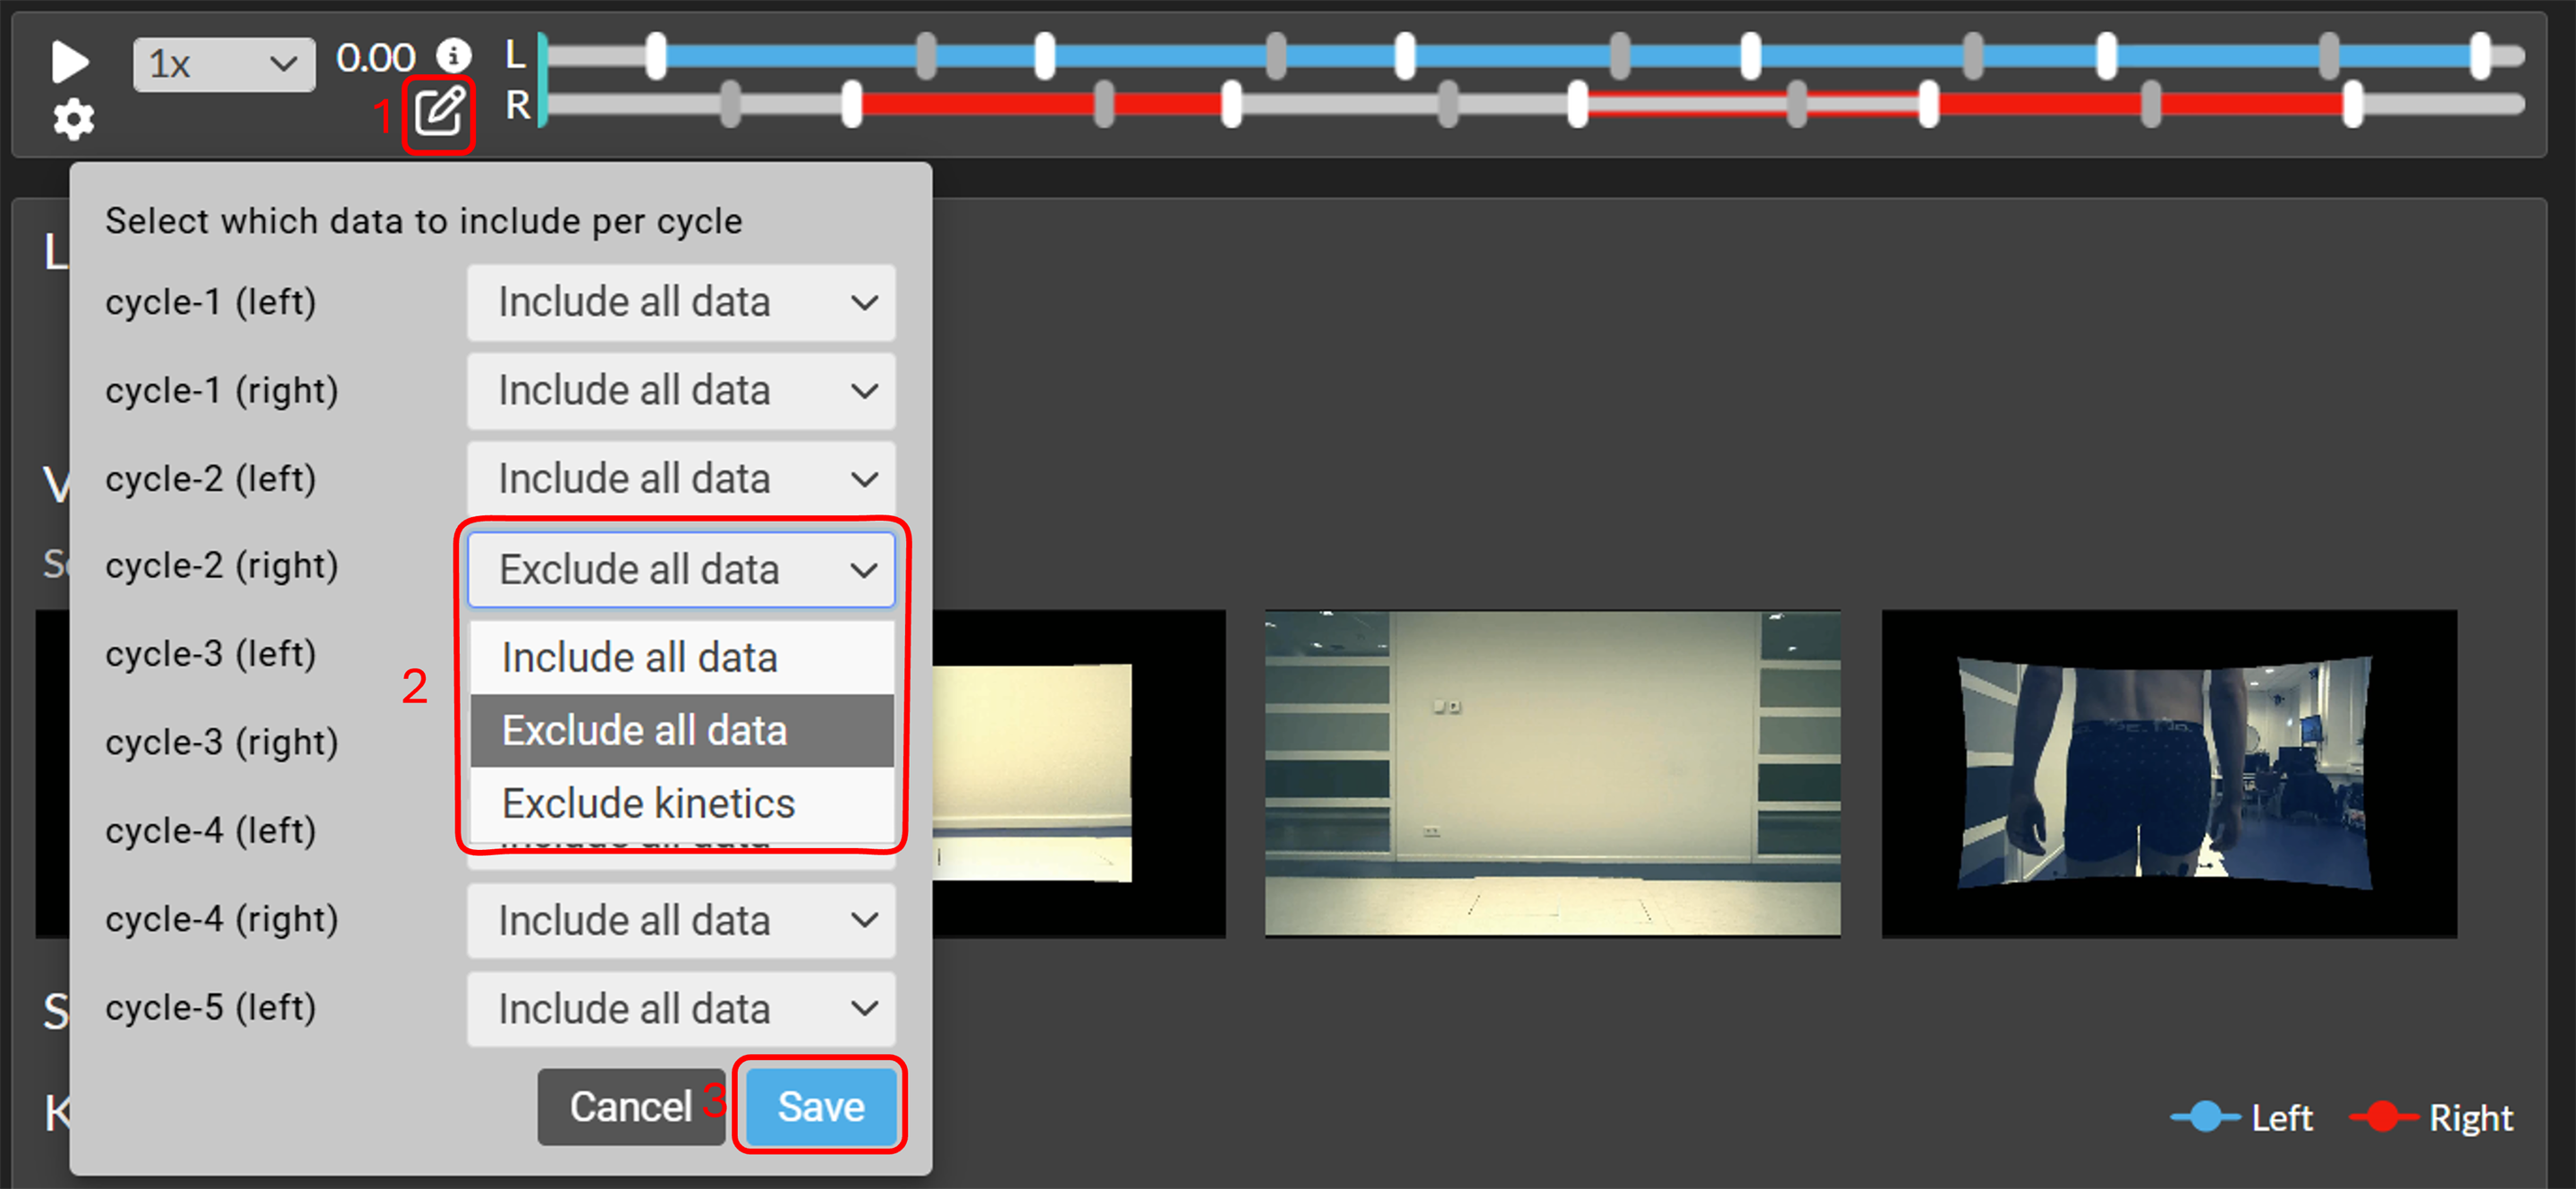
- Click on the Edit icon in the time bar (see 1 in the image below).
- In the pop-up window you can select per gait cycle to Include all data, Exclude all data, or to Exclude kinetics (see 2 in the image).
- Press "Save" to apply the changes (see 3 in the image).The selection will be used for all cycle-based graphs for that trial, and used also for (other) interactive reports and Word reports created with that trial.
To see how the selection is visualized in the time bar, see Playback controls for media.
Tip: Hover over the lines in the graphs to see the cycle numbers.Split screen layout shortcuts
 Note, layout shortcuts can only be opened once the trial/report is fully loaded.
Default layout shortcuts
If you wish to view the same split screen layout for each subject, contact Moveshelf support to set up default layout shortcuts in the project configuration. These layout shortcuts will then automatically appear in each trial and report for all subjects, under the header 'Layout shortcuts' (see image above). Note that default layout shortcuts cannot be deleted.Saved layout shortcuts
With editing rights on Moveshelf (as anTo save a layout shortcut:
- In a trial or report, select your preferred video and/or graphs and open split screen.
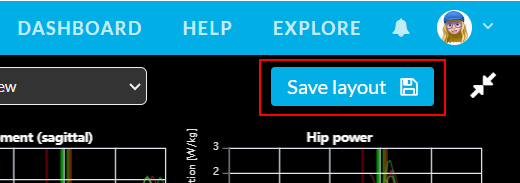
- Click 'Save layout' on the top right, enter a name for this layout and click 'Save'.
To delete a saved layout shortcut:
- Open the trial or report where you want to delete a previously saved layout.
- Click the trash bin next to the layout to delete it.
Reorganize trials and reports
Default Report Order
By default, reports are grouped by report type and ordered alphabetically within each group. The default order of report types is as follows:- Condition Summaries
- Session Comparisons
- Condition Comparisons
Reorder conditions and reports
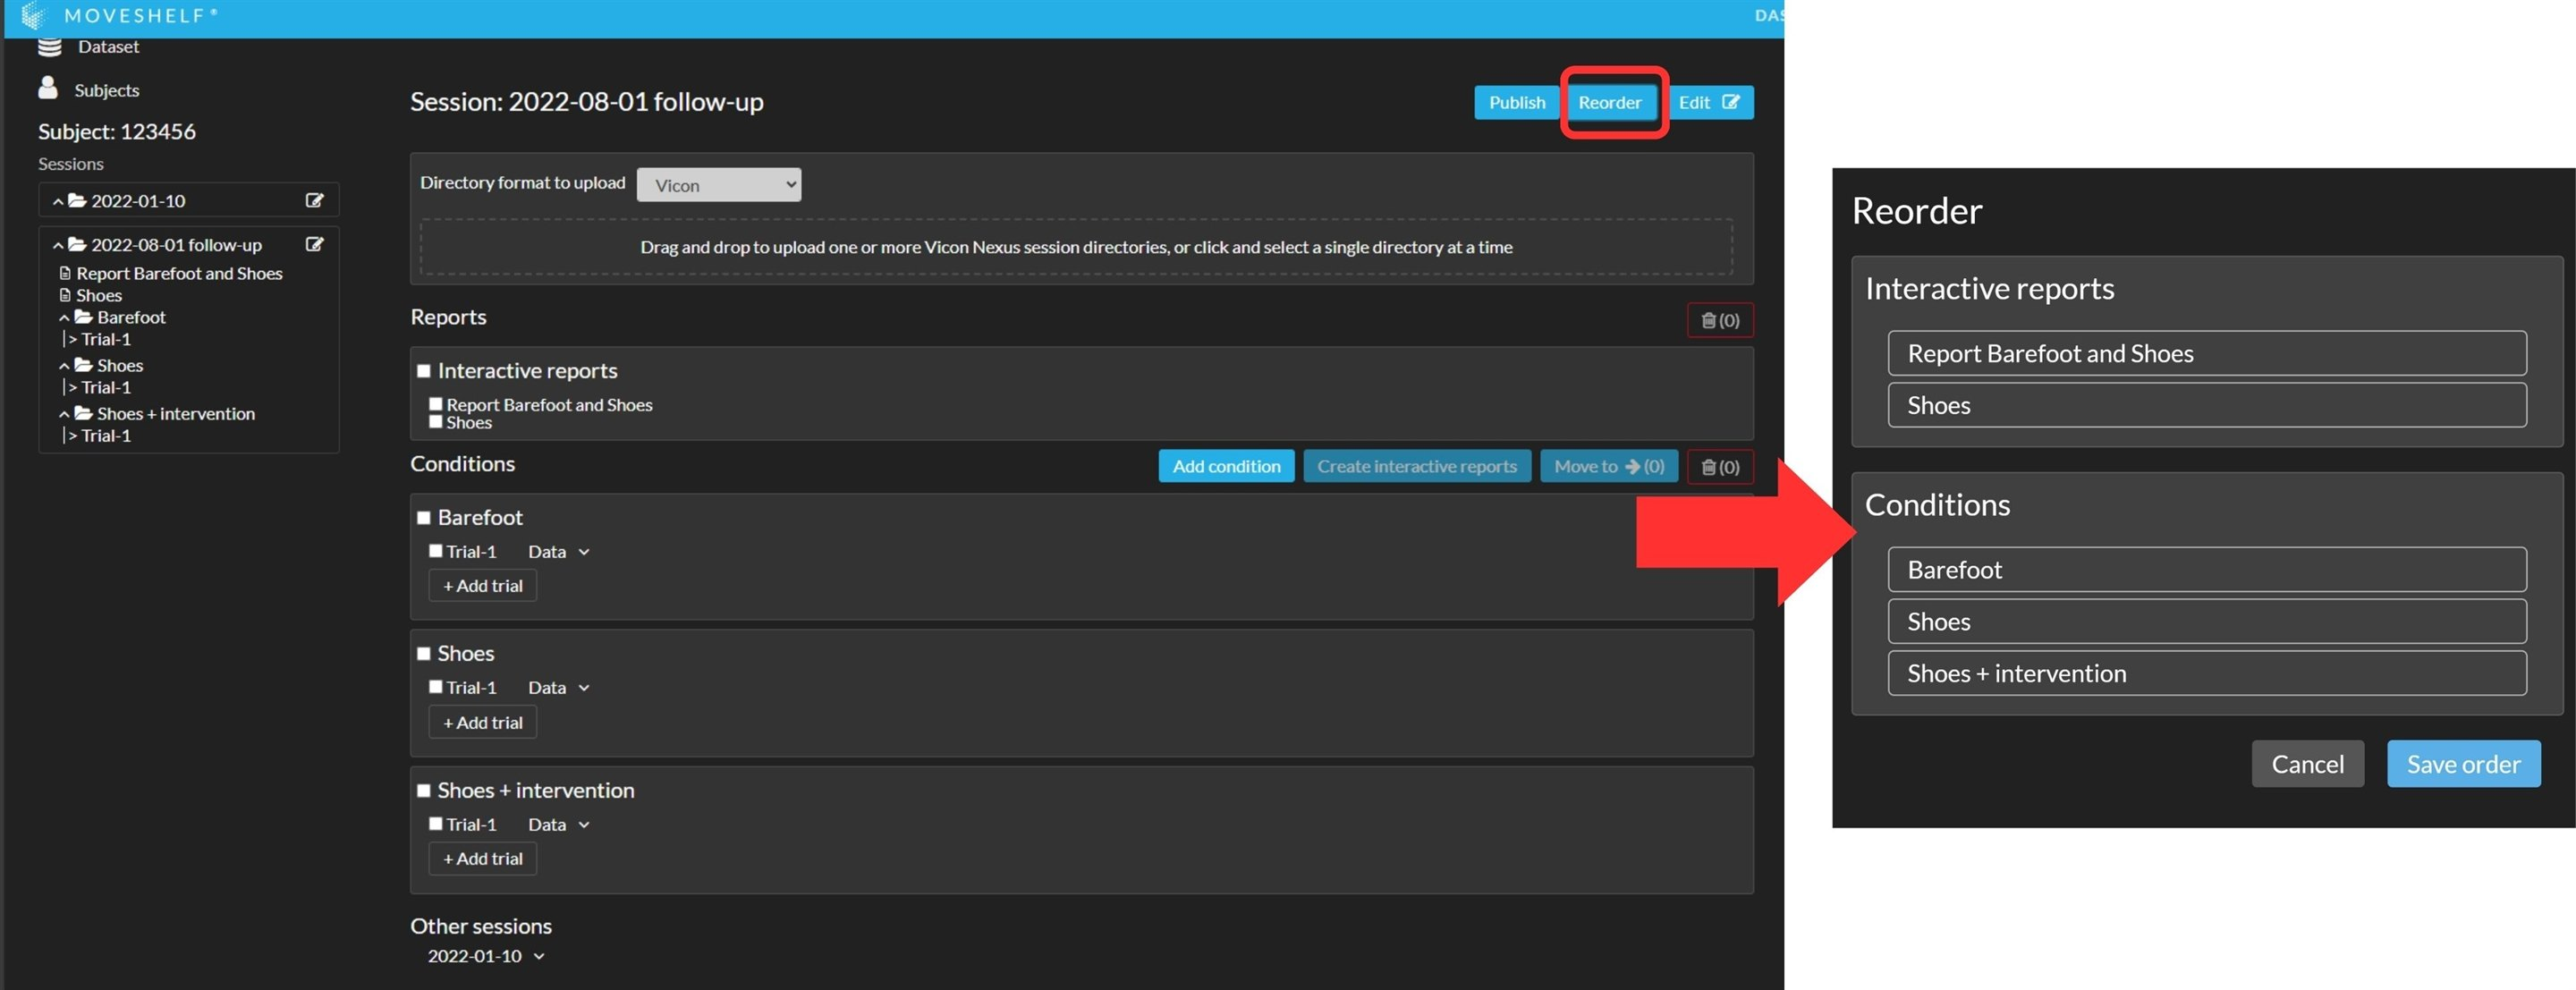
You can reorganize your conditions and reports by using the button 'Reorder':- Click on 'Reorder'.
- In the pop-up window, drag the condition name or report to the desired position within its section. Conditions can only be reordered with other conditions, Interactive Reports with other Interactive Reports, and Gait Word Reports with other Gait Word Reports.
- Click 'Save order' to confirm your changes.
Moving trials to other conditions
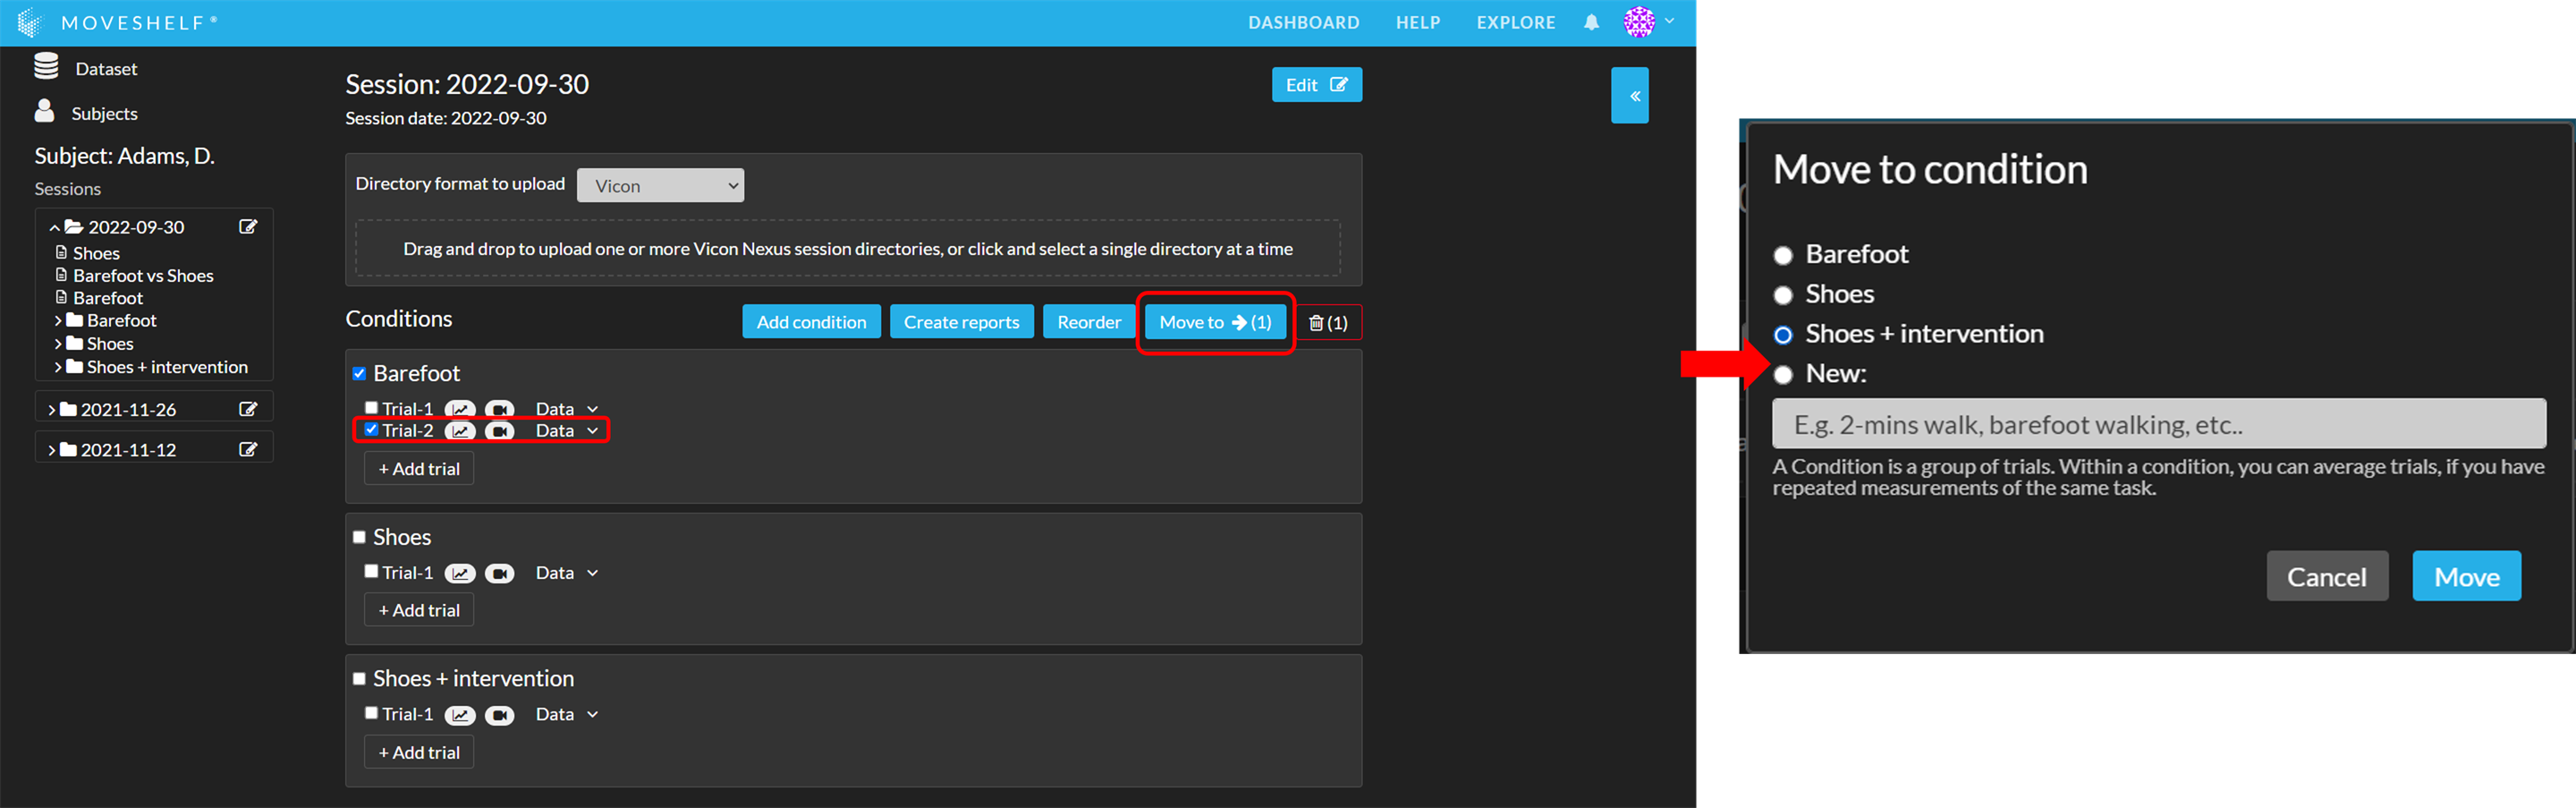
You can reorganize your trials by using the button 'Move to’:
- Select all trials you want to include in a new or existing condition.
- Click on ‘Move to’ and select a condition or create a new condition you want to move the files to.
EMG processing methods
This feature is currently only available for C3D files.
- EMG root mean square (rms)
- EMG envelope (envelope)
EMG root mean square (rms)
The EMG RMS is calculated from the raw EMG channel as a moving RMS with a time window of 25ms. Specifically, we apply a method that calculates the RMS value as:
number of samples in the 25ms time window, and 'x' is the value of the raw EMG value for each sample.
EMG envelope (envelope)
For the EMG envelope, the following processing steps are followed:- Bandpass filter (Butterworth):
- The order of the filter is adjustable (default = 4th order)
- The cut off frequencies are adjustable (default = 20Hz - 450Hz)
- It's possible to switch this filter on / off (default is on)
- Notch filter
- The notch frequency is adjustable (default = 50Hz)
- It's possible to switch this filter on / off (default is off)
- Rectification
- Lowpass filter
- The order of the filter is adjustable (default = 4th order)
- The zero-lag setting is adjustable (default = zero-lag)
- The cut off frequency is adjustable (default = 6Hz)
Please contact Moveshelf support to help you with setting your EMG processing preferences in your project configuration.Add context force plates
This feature is currently only available for Vicon c3d files and mox files.
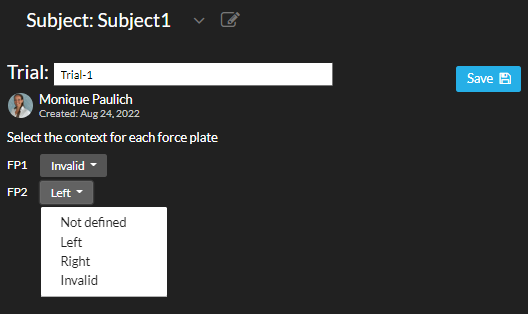
On Moveshelf, you can also edit the Left/Right/Invalid context of the force plates by editing the trial, follow the steps below on how to do that:
- Open the trial on Moveshelf and click the ‘Edit’ button.
- If force plate data is available in the trial, you will see a section on top of the screen that allows you to select and save the force plate context to the trial.
The force plate context on Moveshelf only affects the visualization of force data when it is displayed in Left/Right gait cycle force graphs. They do not affect moments, powers, or cycle selection.
If you want to adjust which cycles are included for moments and powers, we recommend using the feature to Edit data selection per cycle.Once you have edited the force plate context in a trial, make sure to update the report visualization to see the effect in your report, where this trial is included.
Face blurring
This feature is optional and only visible to Enterprise customers with this feature enabled.
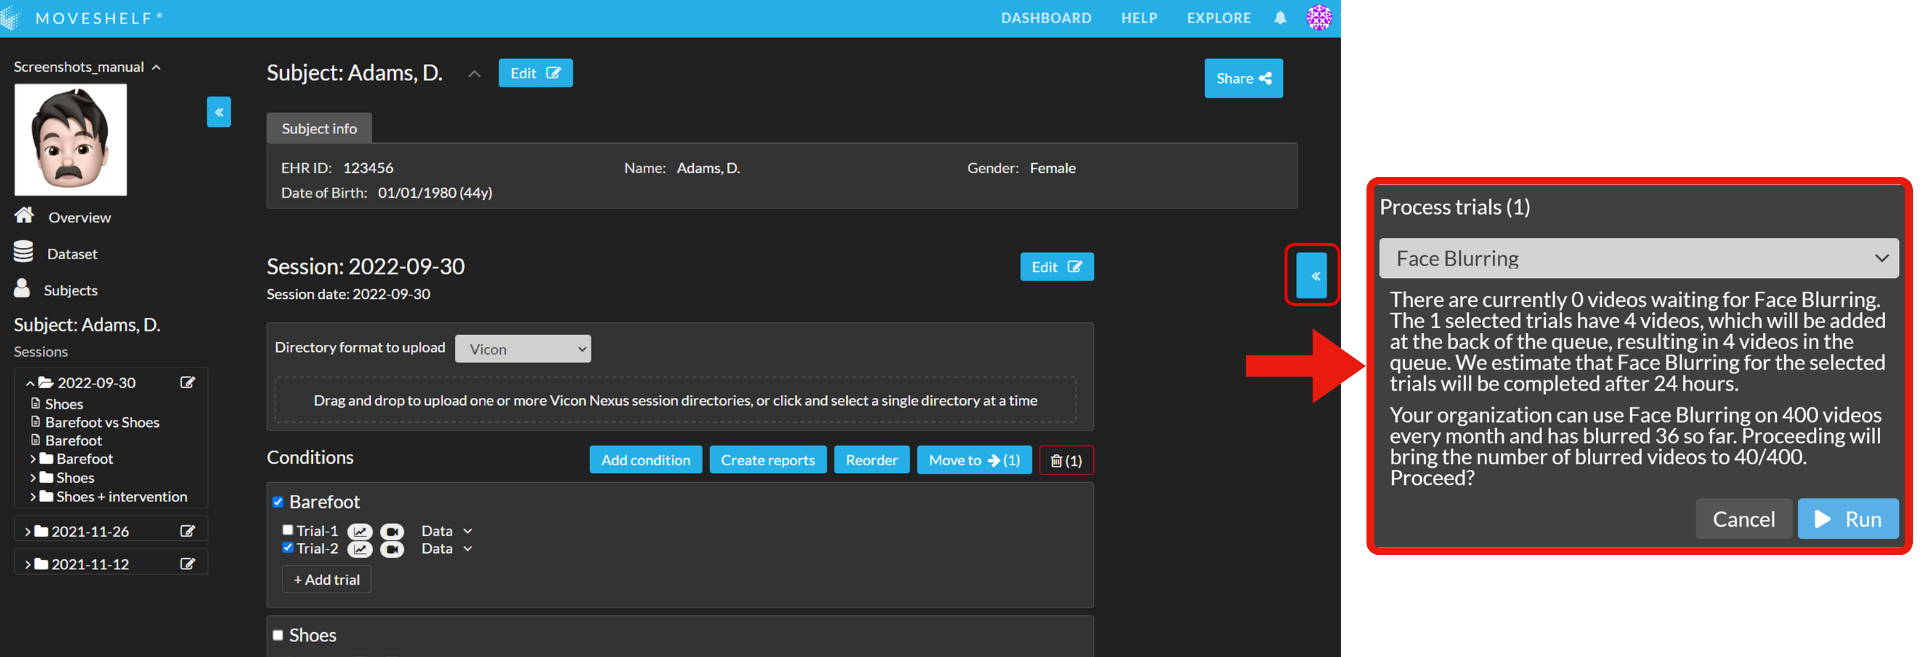
- Select one or multiple trials that includes videos and click on << in the sidebar on the right to open a drop-down menu.
- Select 'Face blurring' and click on ‘Run’.
- You will see feedback of the stage that the trial is in. It will take a few minutes for the first trial to move from ‘Waiting' to ‘Blurring’.
- Please don't access the respective trial when it has the status ‘Blurring’.
- After processing, face blurring is applied to all faces clearly visible in the video.
Please note that, by default, the number of videos that can be processed using the face blurring feature is limited to 400 per month per organization. If you require a higher limit, please contact support@moveshelf.com
EHR Integration
This feature is optional and only visible to Enterprise customers with this feature enabled.
With Moveshelf it is possible to connect movement analysis with existing clinical workflows, by integrating with your local clinical IT system(s), such as an Electronic Health Record (EHR). An integration with an EHR means there is a link between the patient in the EHR and on Moveshelf, based on standardized communication protocols for medical data called HL7 and FHIR. This section focuses on the operator workflow in case of an integration with your EHR.
Integration with an EHR system generally provides the best workflow when combined with Single Sign On, where the login credentials of your organization are used to log into both the EHR system as well as Moveshelf. This way, clinical personnel who are allowed access by your organization to view patient data on Moveshelf, will automatically be logged into Moveshelf when coming from the EHR.Integrations with EHR systems can be designed and developed dependent on the hospital’s requirements. Exact interactions within the EHR software are in control of the wishes and capabilities of your organization and EHR provider’s capabilities. Below are examples of the currently implemented workflows. Please note that these workflows are not the only possible workflows, but merely examples.
HiX (ChipSoft)
A current implementation of a HiX integration contains the following steps for a lab operator from movement data acquisition to sharing the results in HiX, in order to provide the data and comparative overview to the treating clinical team. The steps below describe the workflow after the acquisition of movement data has been performed.
- Create a subject on Moveshelf
- Click the pencil next to the subject name, to add/edit subject information.
- Enter the EHR ID of the patient in the Subject Info panel and click 'Save'. Now, this patient is coupled in HiX and Moveshelf.
- Upload the data to Moveshelf, or import the data through a third party archive integration (e.g. with ArQive. See section Moveshelf + ArQive for more information).
- Sort and/or adjust the presentation of data if preferred, including creating reports.
- In HiX, open the patient's file and navigate to 'Weblinks'. Here you can click a link to Moveshelf and immediately land on this patient's home page where you see an overview of all the patient's movement analysis sessions.
You can copy additional basic patient information from HiX into the subject info panel. To do this, enter the EHR ID of the patient in the text panel on the right side 'Search in HL7 FHIR' and click search. All the information available for this patient is displayed under 'Results'. Click the copy button next to this header to input this information in Moveshelf's subject information. EPIC
An example of an integrated workflow with EPIC is an order based workflow with multiple automated steps. The steps below provide information for a basic understanding of the integration, with a focus on the workflow of a lab operator.
- The clinician orders a movement analysis for a patient in EPIC.
- As a lab operator, places an extra order for gait analysis in EPIC. This order is automatically completed, and initiates a search on Moveshelf for this patient or the creation of a new patient (subject) and a new session on Moveshelf. The order type and date will automatically be added as labels to a new session on Moveshelf.
- Open the patient on Moveshelf by navigating to the url of Moveshelf for your organization: < organization >.moveshelf.com, and in Moveshelf, search for the subject using the EHR ID from EPIC.
- Upload the data to Moveshelf.
- Sort and/or adjust the presentation of data if preferred, including creating reports.
- Click 'Publish' when the session is ready to be shared with the clinician/team responsible for treatment. This action will visualize a link to the specific patient in Moveshelf in the patient file in EPIC and allow viewers access.
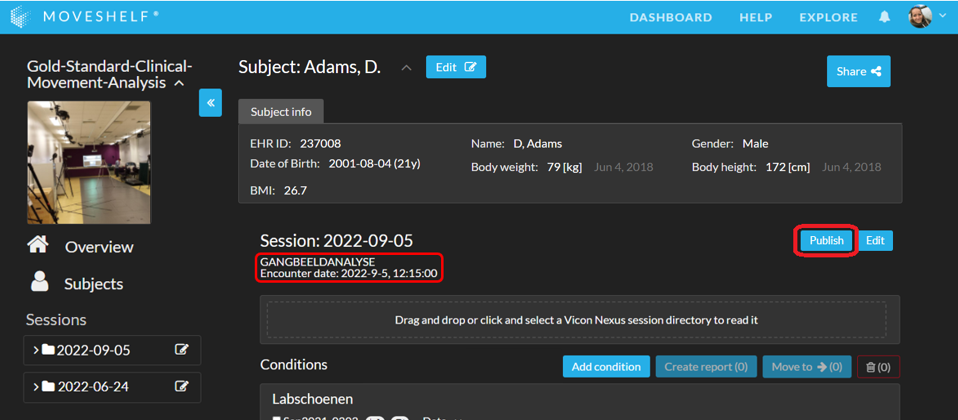
Opening Moveshelf through the URL in the patient file in EPIC opens the application in protected mode where you have only access as a viewer and switching to another patient on Moveshelf is not possible. As an operator, the recommended workflow is to manually navigate to your Moveshelf domain easily by saving it as a bookmark in your browser.
Force overlay
This feature is optional and only visible to Enterprise customers with this feature enabled.
For all supported formats, Moveshelf extracts force plate data, including force vector magnitude and direction, from the respective file. The system reads the calibration and positional information of the force plates and maps the force vectors onto the corresponding video frames. Using embedded metadata and Direct Linear Transformation (DLT) matrices where applicable, the force vectors are scaled and projected onto the videos to create overlays.
If the force overlay function is enabled for the user's project, the respective file (.box, .mox, .c3d) can be included in the directory upload folder or stored under a condition "Additional files" in a trial.
See the section Playback controls for more info on general viewing of data, including the automatic display over force overlays if this feature has been enabled and supported for your data format.