Explore data

Every user has his own personal homepage, called ‘Dashboard’. Your dashboard holds an overview of all projects of which you are a member.
Click on the Moveshelf logo or click on ‘Dashboard’ in the menu bar on top of the page to navigate to your personal overview of projects.
Opening data through URL
Once you're on the page of a report or trial, a navigation menu appears on the left side of the screen to easily switch between trials, conditions and reports (please see section Navigation menu). Please see sections Trial and Report to learn more about looking at your data on Moveshelf.
Subject home page
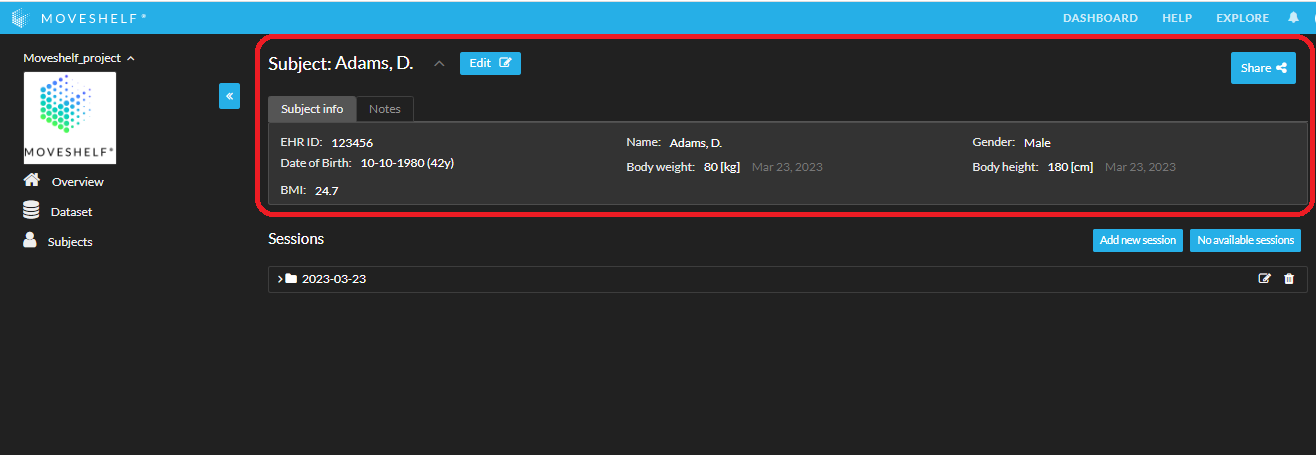
Subject information
In the subject home page subject information will be displayed. Subject info and the other tabs like Notes and/or Physical Examination will only be present if the lab operator populated information in these sections.View Movement data
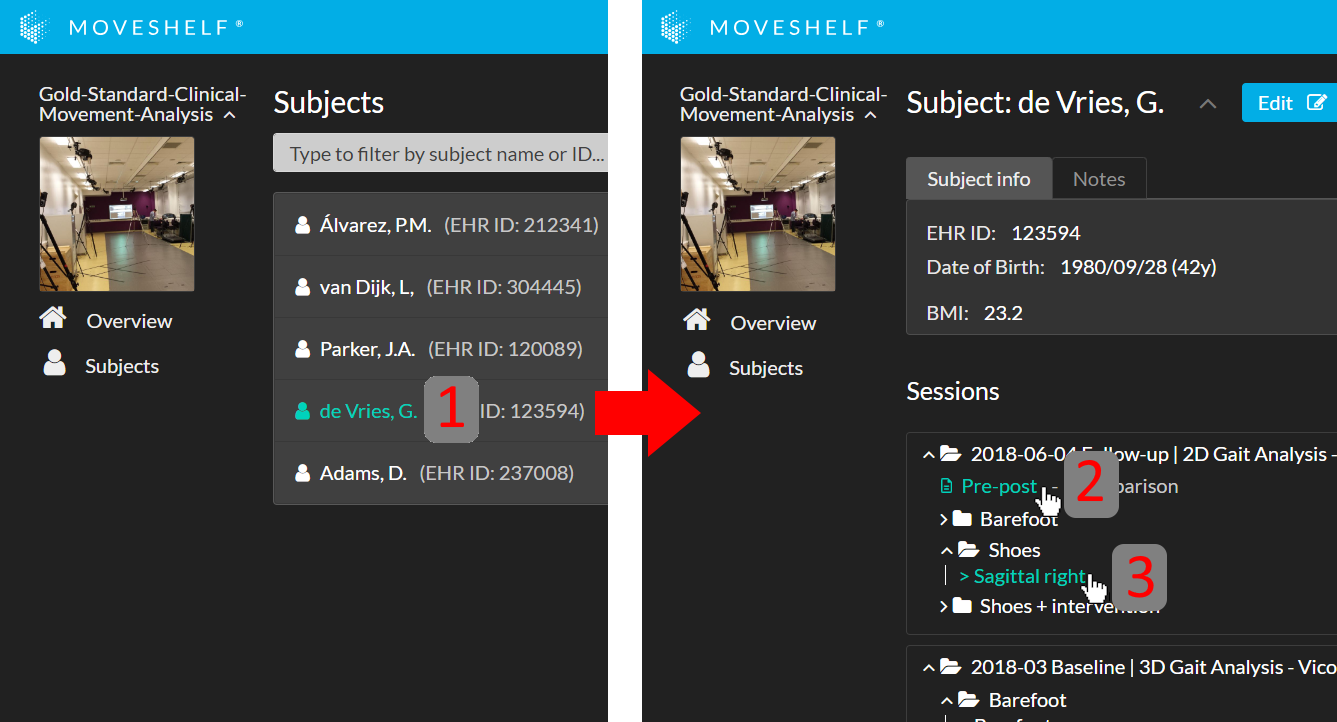
Below the subject information, movement data is displayed. The movement data is ordered by when the subjects' sessions were created. The session includes all the conditions that have been captured and subsequently each condition includes the trials that have been performed. When you click on the session-date-header, the conditions and each trials will be shown, this way you can navigate to the desired conditions and each trials.Navigation menu
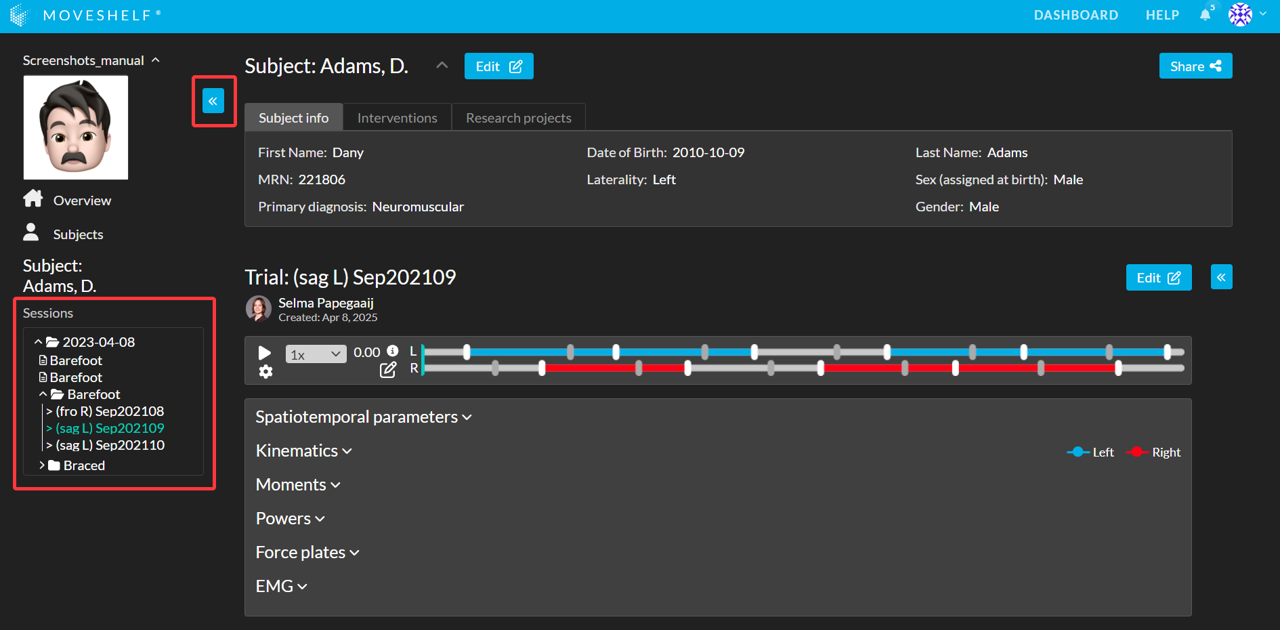
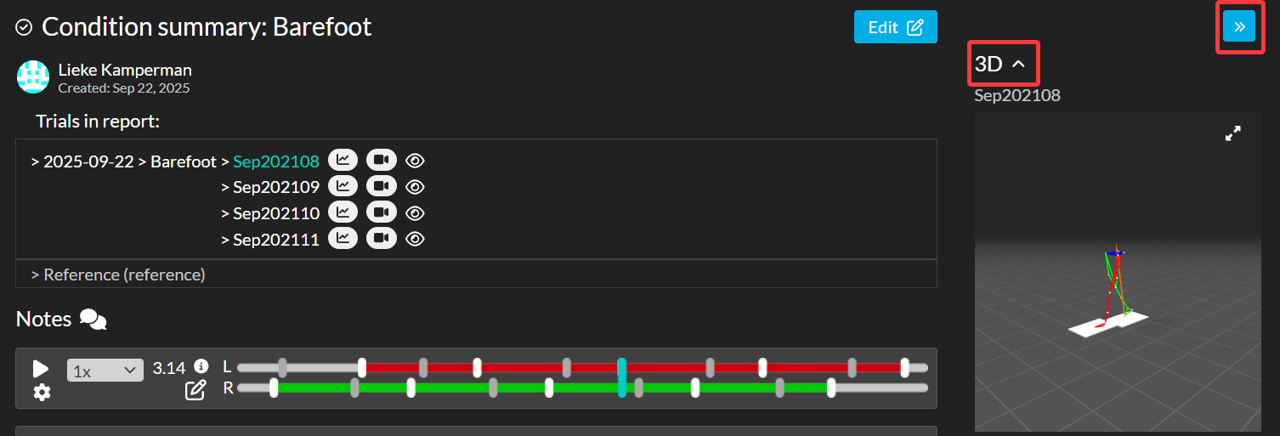
You can hide the navigation menu with the blue ""<<" button at the top left of the page, to free up more space to view your data.
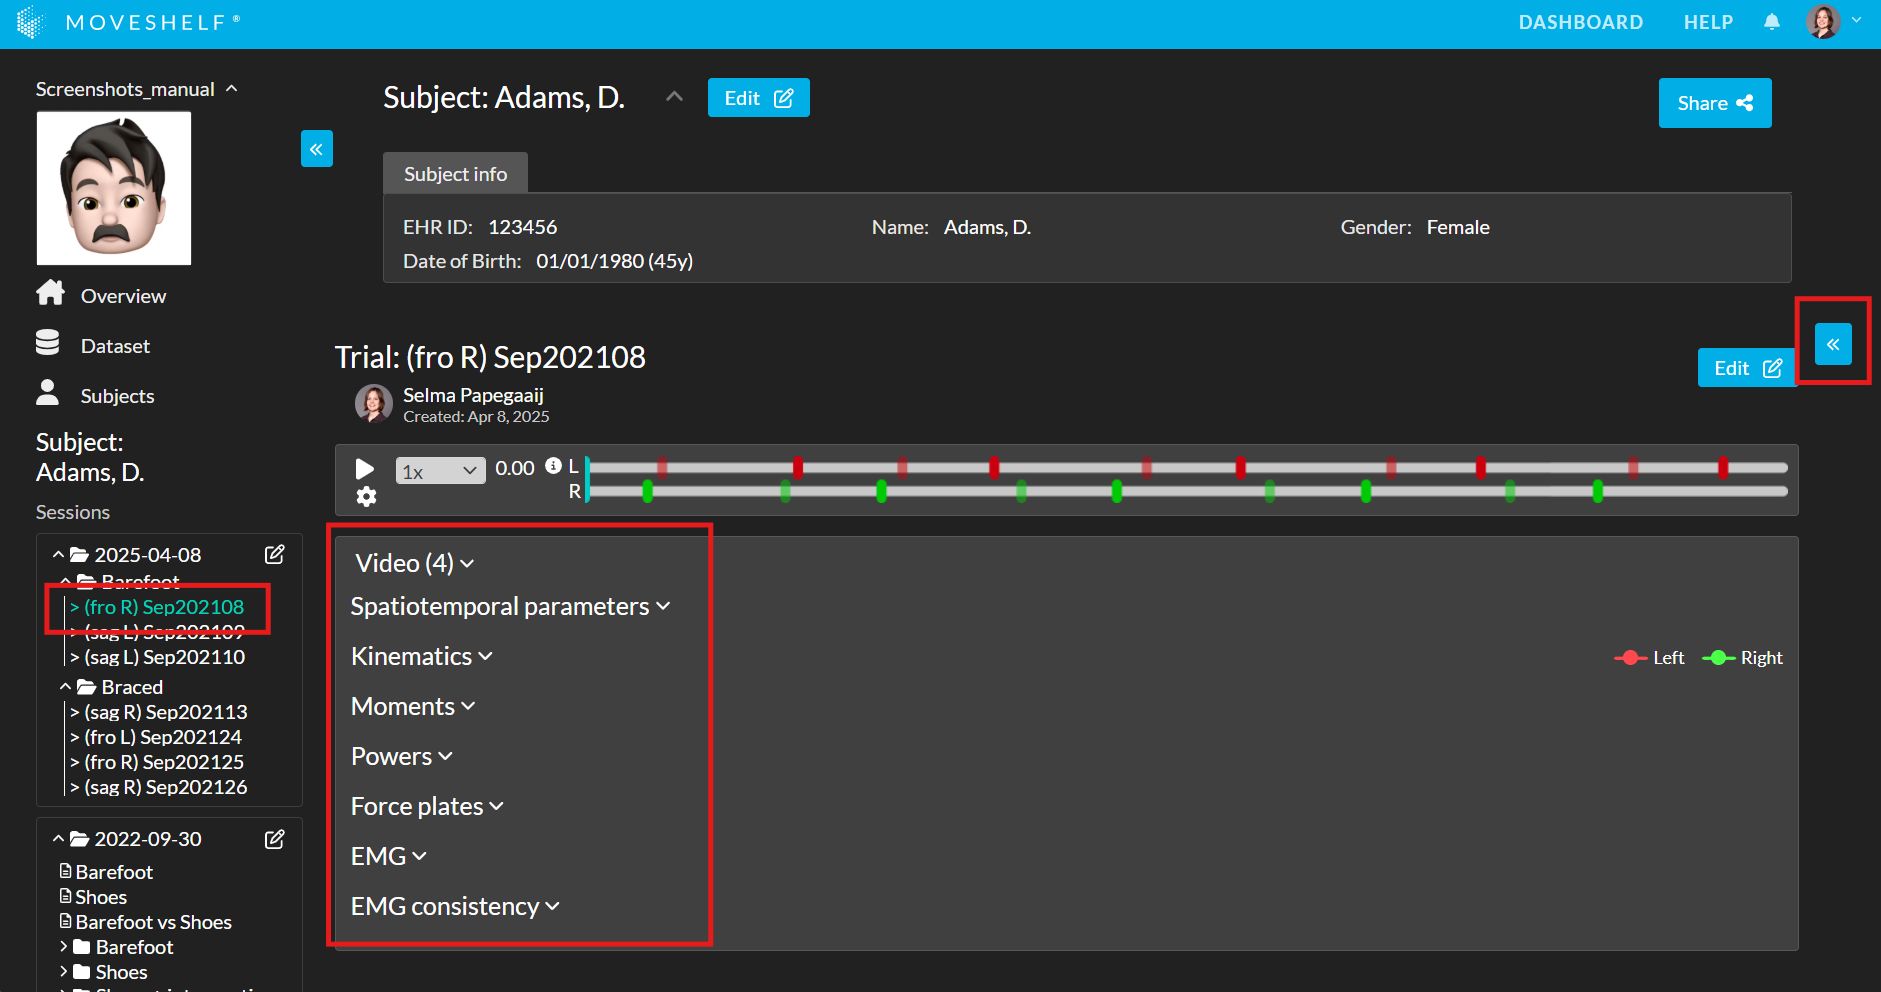
Trials
- 2D videos
- 3D player
- Gait parameters
- Kinematics
- Moments
- Powers
- Force plate data
- EMG
- EMG consistency
The trial you are viewing is highlighted in the navigation menu on the left side of the screen. Within a trial, click on the headers of the data type to expand the section.
If 3D data (avatar) is available for the trial, it will appear in the panel on the right side of the screen. This right sidebar is collapsed by default—to view it, click the blue “<<” button on the right.
For more info about graph features, go to interactive graphs.
Reports
Explore data in the report
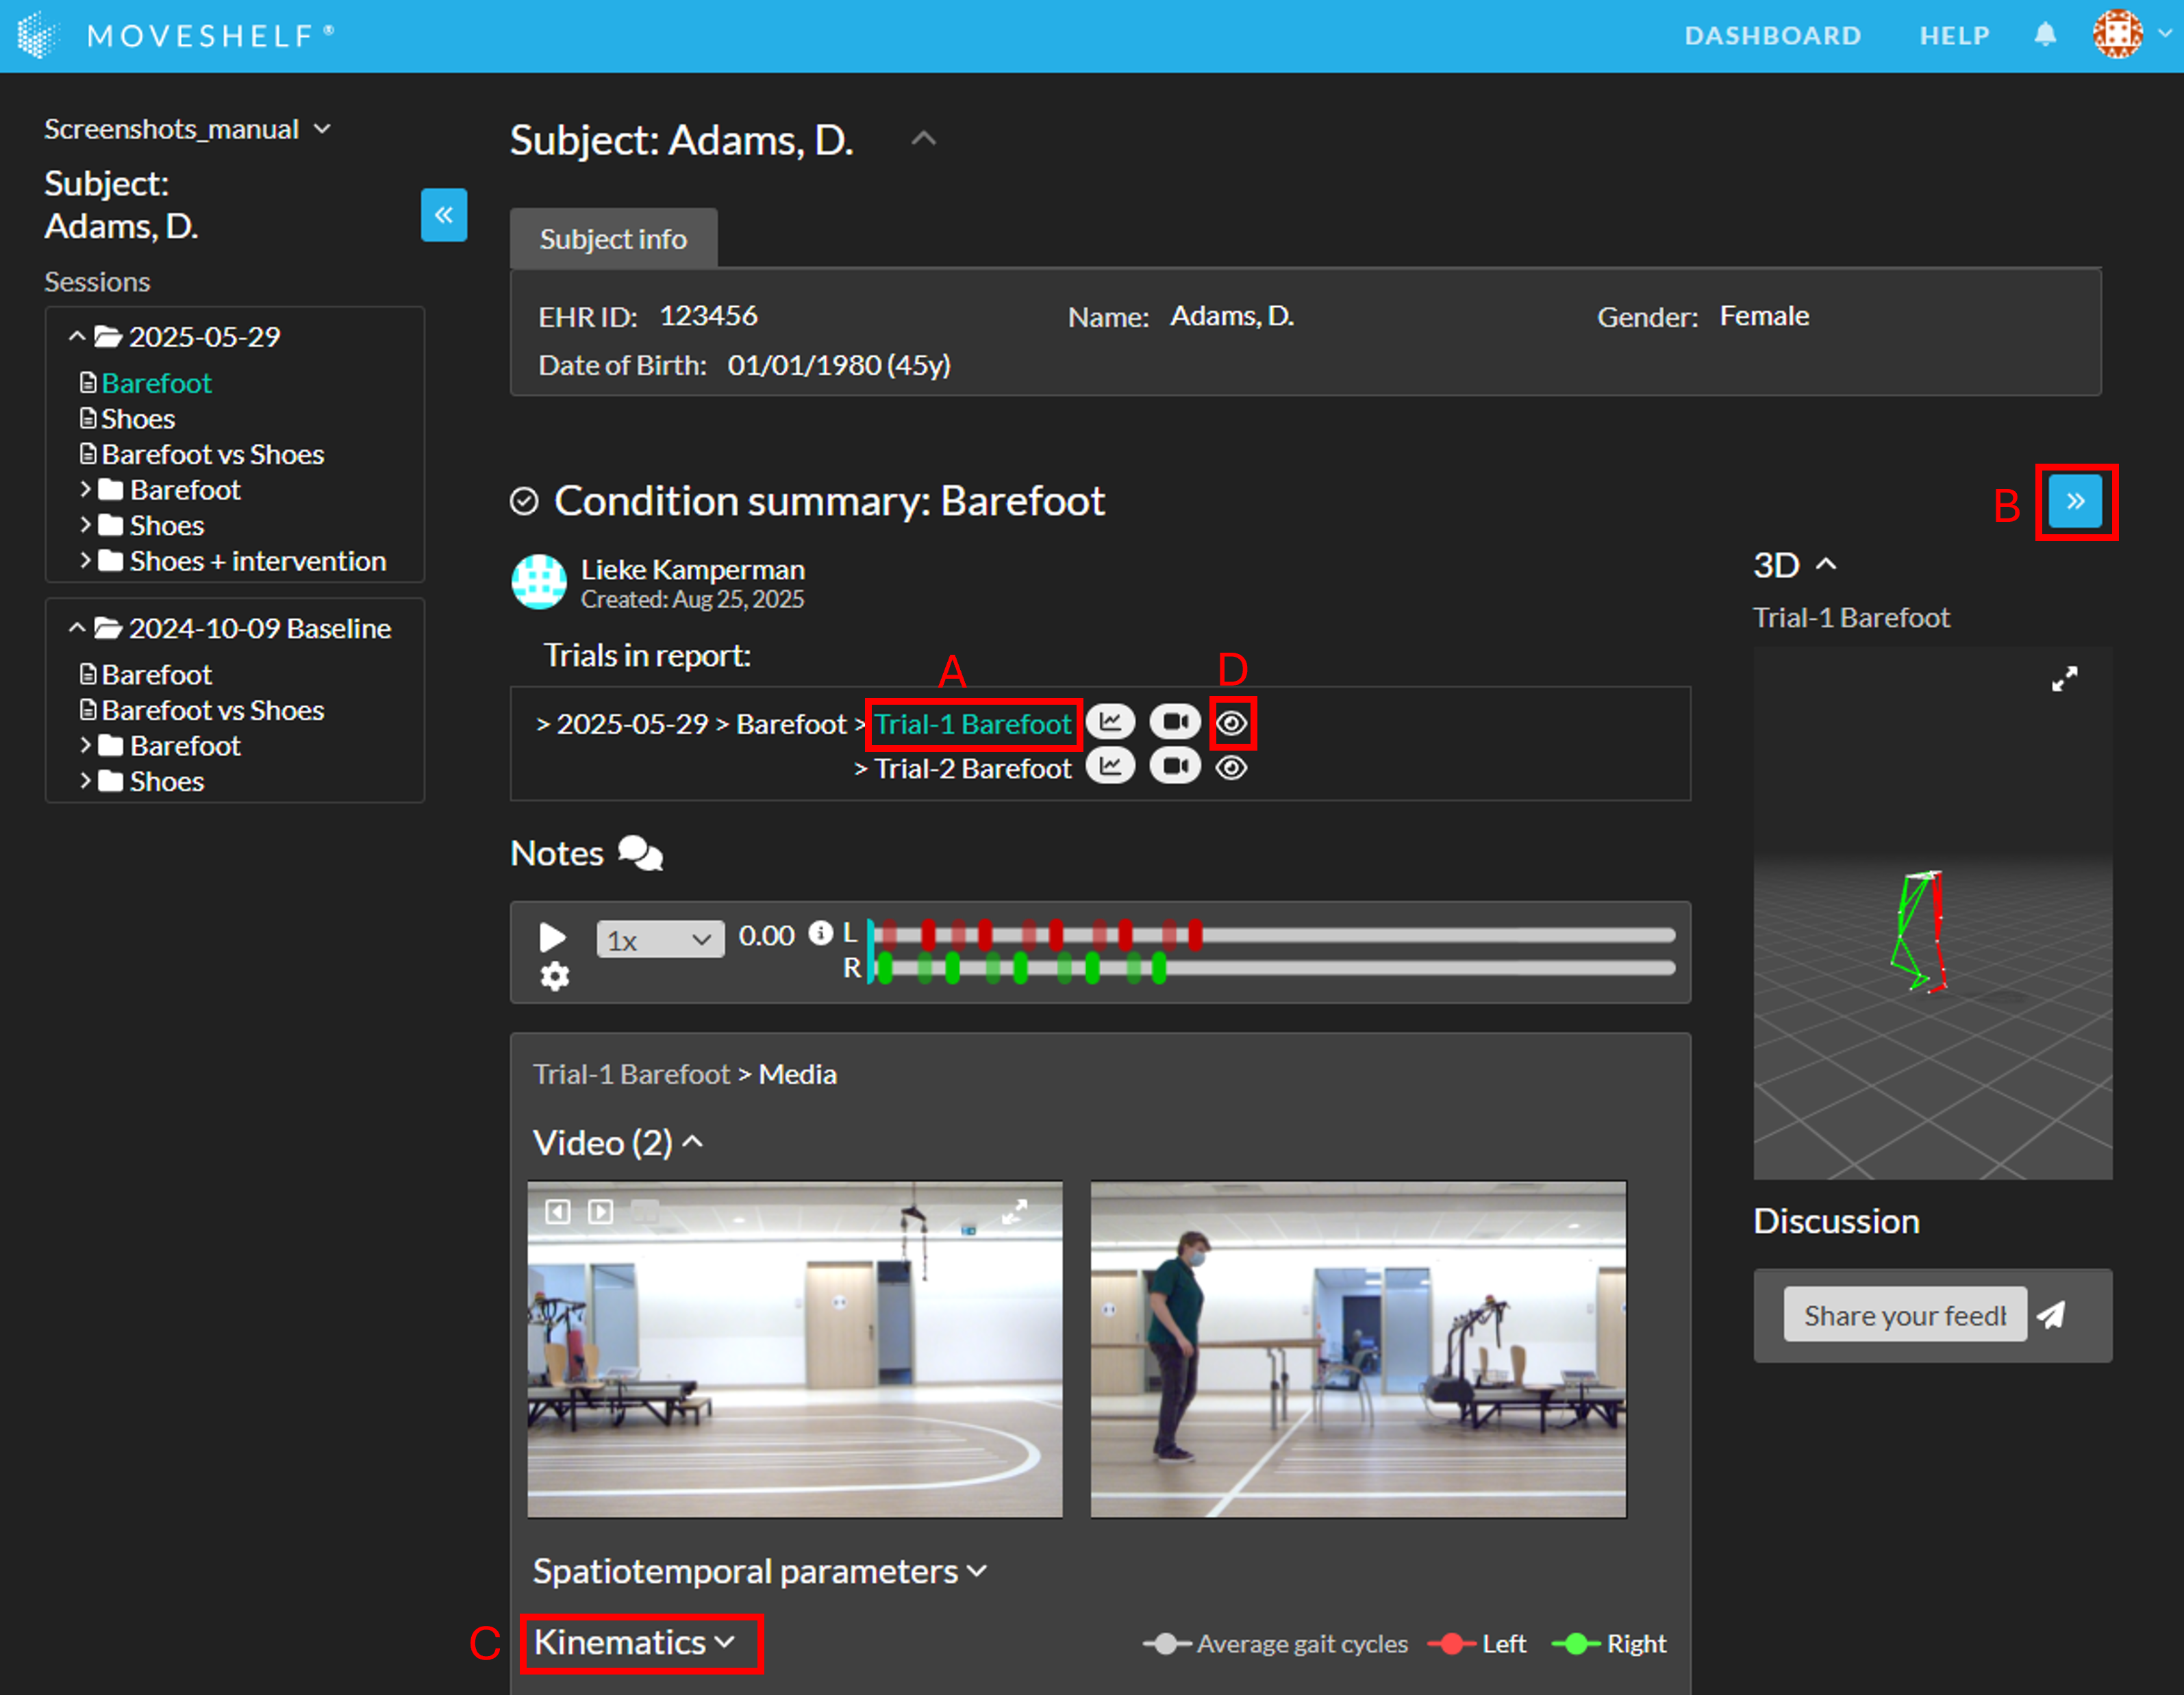
- To view the 2D video, 3D player and/or EMG consistency graphs of one of the trials, click on the trial name below the header ‘Trials in report:’ (see A in screenshot below).
- The 2D videos will be displayed just below the playbar.
- The 3D player will be shown on the right side of the page. If the right sidebar is hidden, click "<<" to open it (see B in screenshot below).
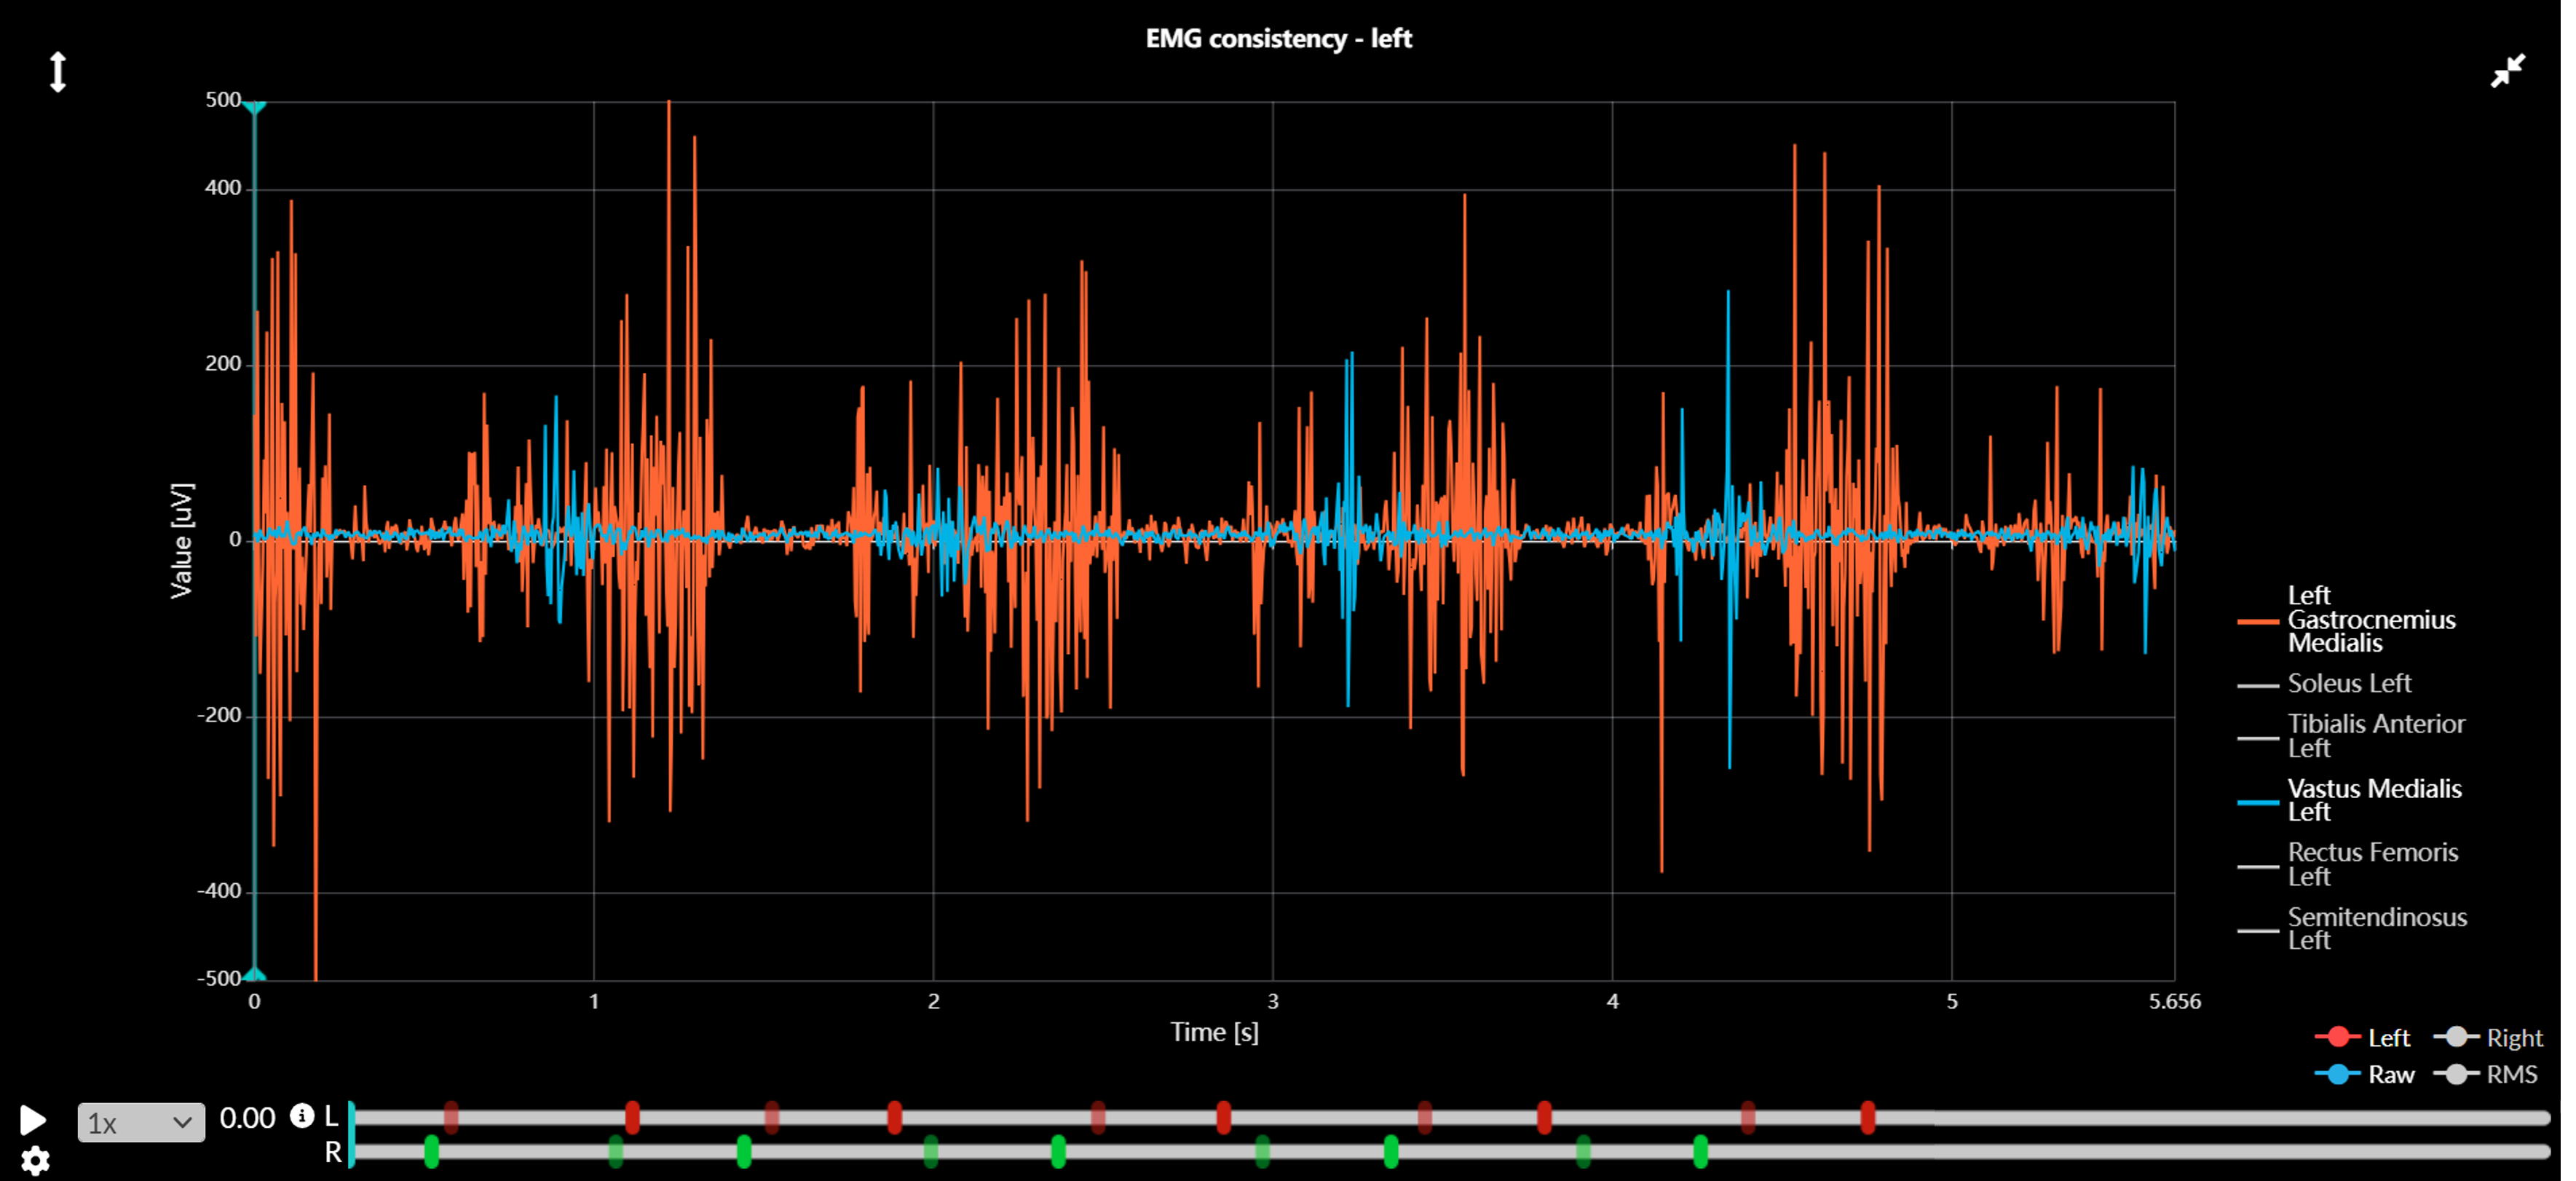
- The EMG consistency graphs will be displayed at the bottom of the report in the EMG consistency chart group (see C in screenshot below).
- To open other types of data in the report (e.g., Kinematics, Moments, Powers, EMG) click on the header of the data type you would like to view (see C in screenshot below).
- Click on the 'eye' icon to hide/show all gait cycles of a trial from the report (see D in screenshot below, or the video). Please note this feature only works for graphs with individual (non-averaged) gait cycles. For other graph interactions, see the section interactive graphs.
Explore data in the report:
 Show/hide trials in graphs in a report:
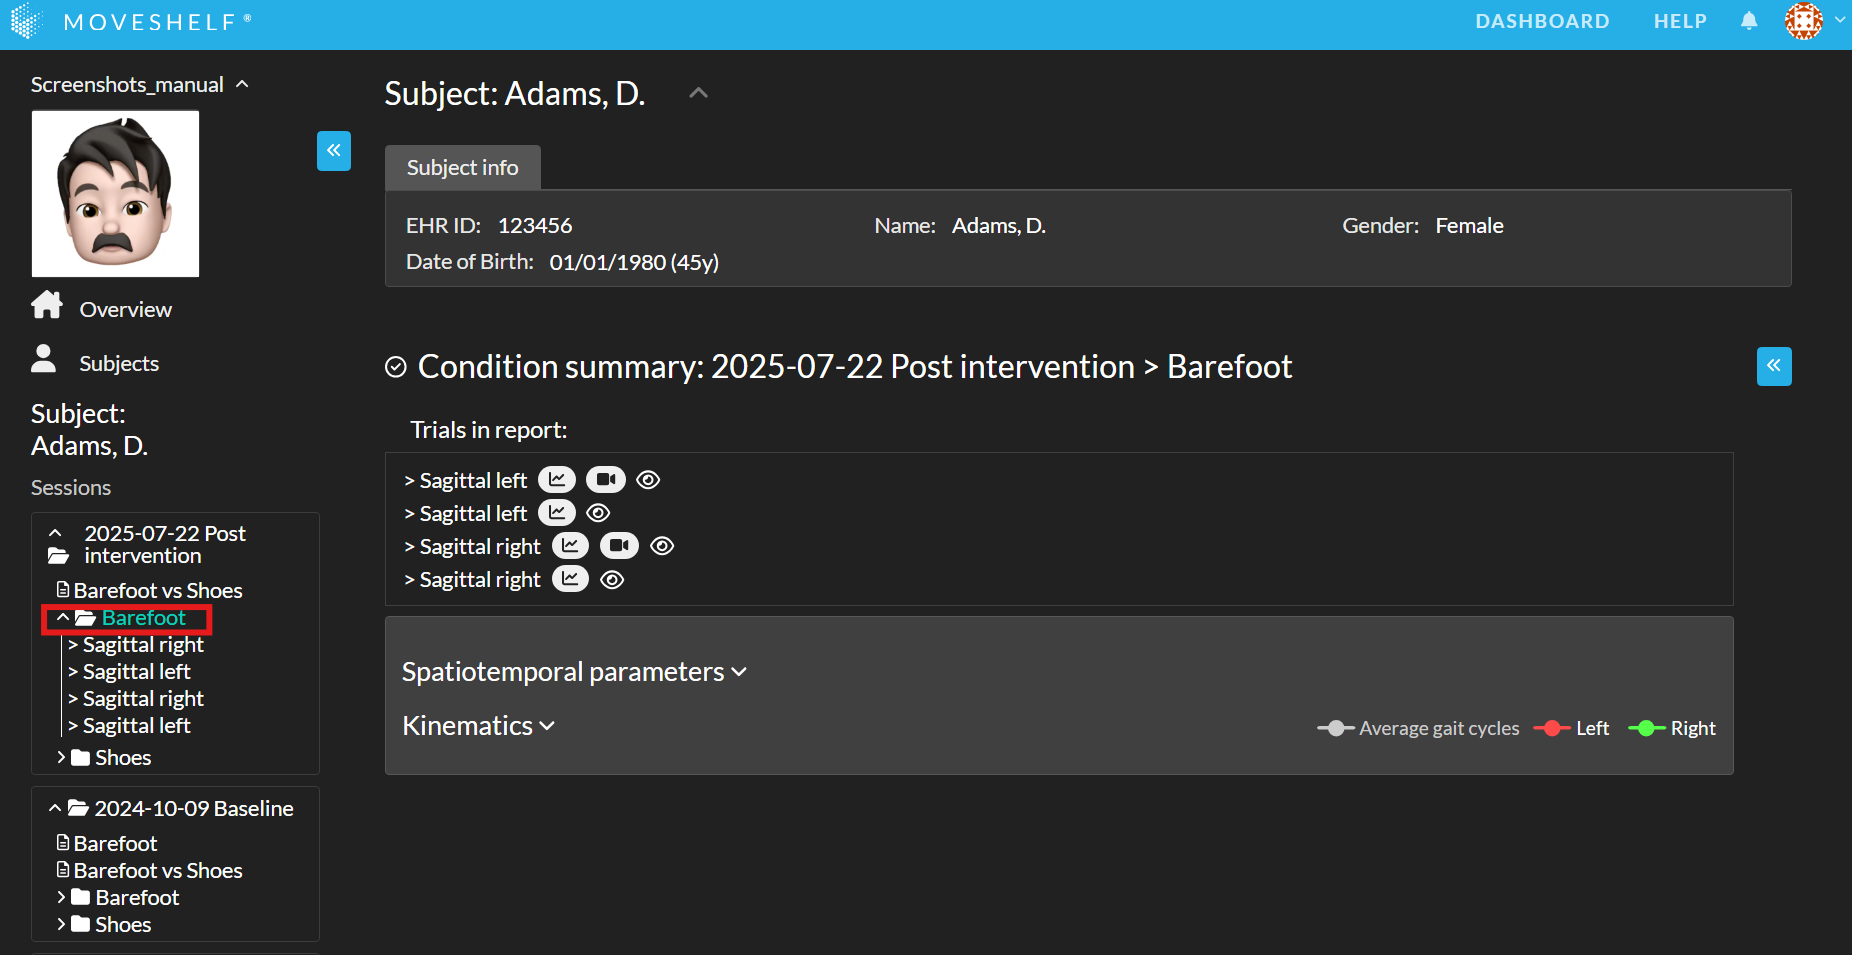
Clickable condition summary

 This feature is optional and only visible to Enterprise customers with this feature enabled.
- By clicking on the condition header in the subject home page.
- By clicking on the condition header in the session home page.
- By clicking on the condition header in the navigation menu.
Playback controls for media
This section provides information on interacting and viewing options for videos and the 3D player on Moveshelf. ‘Playback controls’ contain short keys to manipulate the timeline of your recordings.
General
- Click on the arrows at the right top of any window (3D, video or graph) to open it in full screen.
- When in full screen or split screen a 'skip to next' icon appears in the top left corner of the video to easily go to the next video of this trial (see the section about Split screen for an example).
- If force vector overlay data is present and supported for your dataset, the vector will be displayed on top of the videos that are included in that trial. For more information see the section about Force overlay.
Time bar
- Use the time bar on top of the page to play all media in sync.
- Change the playback speed to view all media in slowmotion using the dropdown menu next to the play button.
- Hover over the 'i' in the time bar to view all playback controls. For more details, see the Video playback controls section below.
- If gait events are present in your data, the time bar will be split into left (L) and right (R), and gait events are shown in the time bar (see image below).
- On a dark background "Heel strikes" are white, and "Foot offs" are grey.
- On a light background "Heel strikes" are black, and "Foot offs" are grey.
- The colored bars show which gait cycles are included in the data (see Edit data selection per cycle)
- To hide the "Foot off" events, click the gear icon in the time bar, then click the eye icon next to "Foot off".

3D player:
- If 3D marker data is present and supported for your dataset, it will appear in the panel on the right side of the screen. This right sidebar is collapsed by default—to view it, click the blue “<<” button on the right. Click on the header '3D' on the right side of the screen to expand and show the 3D player to see the 3D avatar.
- If calibration data of your cameras and 3D marker data is present and supported for your dataset, you can combine the 3D avatar and a trial's video in one view. Read more about how to use this feature in the section 3D avatar overlay in video.
Video playback controls
- Tap or click on time bar: jump to time
- K or spacebar: play/pause
- Time bar replay loop - create selection:
- Hold mouse cursus motionless over time bar (>0.5s), then drag to make a selection (see video below)
- Shift + i: set selection start
- Time bar replay loop - cancel selection:
- Double click on time bar outside the selected area (see video below)
- Shift + o: set selection end
- Shift + hover on time bar: jog
- J or left-arrow: jump – 20ms
- L or right-arrow: jump +20ms
3D player controls:
- Left click: orbit camera
- Right click: pan camera
- Mouse wheel: zoom
- f: toggle follow camera
- Shift + l: show/hide optical segments
- Shift + m: show/hide markers
- Shift + h: toggle GRF visualization
- Shift + >: show/hide markers trajectory
- Shift + t: show/hide technical mesh
- Shift + f: select next chart
- Shift + ): ortographic/perspective camera
- Shift + n: select next take
Split screen
How to work with split screen
- Open a split screen layout directly from one of the links in the 'Layout shortcuts' header on top of the trial or report page. This can be either a default layout shortcut (available in each trial / report), or a saved layout shortcut that the operator prepared for this trial or report.
- Or make a manual selection of your own preferred items by following the next steps (or see video below):
- Manually select up to 2 graphs, data groups (e.g. Kinematics), videos and/or the 3D player for either the left or right side of the screen by clicking on the small arrow at the top left of the graph/video/3D player or right next to the header of the data group (the icon appears when hovering over the graph/video/3D player).
- Next, click on the 'split screen' icon right next to the previously mentioned arrow icon to open your selection in the split screen (full screen).
Basic interactions and features in split screen Show videos from different trials
You can also show videos from different trials in one split screen, for example to compare videos from different conditions or sessions. The videos can be synchronized on a gait event if this information is available. Please read the instructions below or watch the video at the bottom of this section. - Click on a trial on top of your report that you would like to have as your primary trial for playing media. The primary trial leads the synchronization, meaning that this trial is used for the time bar and playheads.
- Open split screen with at least one video of this trial.
- Use the dropdown to switch one of the splitscreen tiles to a video from another trial that is part of the report. Note, you cannot change the first video you selected, as this is used for the primary trial.
- Another dropdown menu will appear in the middle above the playbar. You can use this dropdown to select the (gait) event to synchronize the videos of the different trials.
- You can now play the videos of the different trials alongside each other, in combination with any data if preferred. The active gait cycle from each selected trial will be highlighted in the graphs.
- Click on the 'skip to next' icon in the top left corner of the video in split screen to go to the next video of this trial.
- Open the dropdown menu in the top left corner of each splitscreen tile to easily switch between graphs / videos / 3D player.
- Click on the buttons 'Left' or 'Right' at the bottom right to switch off/on the left or right side for all graphs.
- Use ctrl + scroll wheel to zoom in on the x-axis and alt + scroll to zoom in on the y-axis of the graphs, to have a more detailed look at the data.
- Change the playback speed to view all media in slowmotion using the dropdown menu next to the play button.
- If you are in split screen and zoomed in on the movement data, the graph will follow the playbar during the playback.
- To optimize your view, you can open your browser in full screen mode by using the following short cut keys:
- For Windows and Linux: F11
- For MAC: Press ⌘ + Ctrl + f
- For analysing EMG-signals (e.g. single EMG-graphs or EMG-consistency graphs) in prolonged gait cycles make sure to select video(s) for the left side and graph(s) for the right side of the split screen. After opening the split screen with this selection a double arrow on top is shown which enlarges the graph section. See the video below.
Tips while using split screen
Optional, additional features
 These features are optional and only visible to Enterprise customers with (one of) these features enabled.

Interactive graphs
All graphs or other visual representations of data are interactive on Moveshelf. In this section we explain the basic interactions.
- Hover over a curve to see a tooltip with the x- and y-value of that point in the curve.
- Click on a curve to jump to that time. The selected gait cycle will become the active gait cycle and will be highlighted.
- Click on an item in the graph's legend to show/hide line(s) in that graph. This comes in handy to reduce the amount of lines in this graph (see video below).
- To hide all data belonging to the right or left side of the subject in your trial or report with just one click, click the Left or Right button on the top right corner of the trial/report (see video below).
- Click the "Average gait cycles" button at the top right corner of the report to switch between viewing all gait cycles separately and combined using the average and standard devation (see video below). The average line is an average of all gait cycles in all trials, grouped by side and condition (if available). Default is single cycle view.
- Click on the diagonal arrows in the top right of the graph to open it in full screen.
- Click on the vertical arrows in the top left of the graph to set the y-axis to either fixed limits or fit-to-data.
- To have a more detailed look at the data, you can zoom in on both axes. The zooming experience is best when you are in split screen view.
- Use ctrl + scroll wheel to zoom in on the x-axis.
- Use alt + scroll to zoom in on the y-axis.
- Use ctrl + alt +scroll to zoom in on both axes at the same time.
- Vertical lines are drawn at the transition from stance to swing phase (moment of Foot Off) for each detected cycle.
Synchronized graphs
- Graphs that have only one channel (no left and right, like trunk or pelvis data) have one playhead.
- Graphs that have channels for left and right (e.g., legs) have two playheads, one for each side (red and green, respectively).
In case data is plotted over gait cycles instead of a timeline, the gait cycles are plotted on top of each other in a graph. The active gait cycle will be highlighted, together with the corresponding stance-to-swing
EMG consistency graphs

 This feature is optional and only visible to Enterprise customers with this feature enabled.
To analyze relations between EMG channels (e.g. crosstalk or relative timing in activation patterns) the EMG consistency graphs can be helpful. These graphs are available at the bottom of a trial and report, and in the dropdown menu in split screen. In split screen initially only the first EMG channel is shown. You can manually (de)select EMG channels and enable/disable raw or RMS EMG tracks by clicking on the legend items next to the graph.
Spatiotemporal parameters
Report view
- In a comparison report the mean and sd are calculated by grouping all trials per condition.
- With multiple conditions present in your report that contain at least one trial with spatiotemporal parameters per condition, you will get a mean and sd for each condition. You can hover over the values with your mouse and a tooltip with show which condition these values belong to (see an example of a comparison report in the video below).
- In a condition summary report will calculate the mean and sd of all trials included in the report regardless of the condition.
3D avatar overlay in video
How to create the 3D overlay in a video:
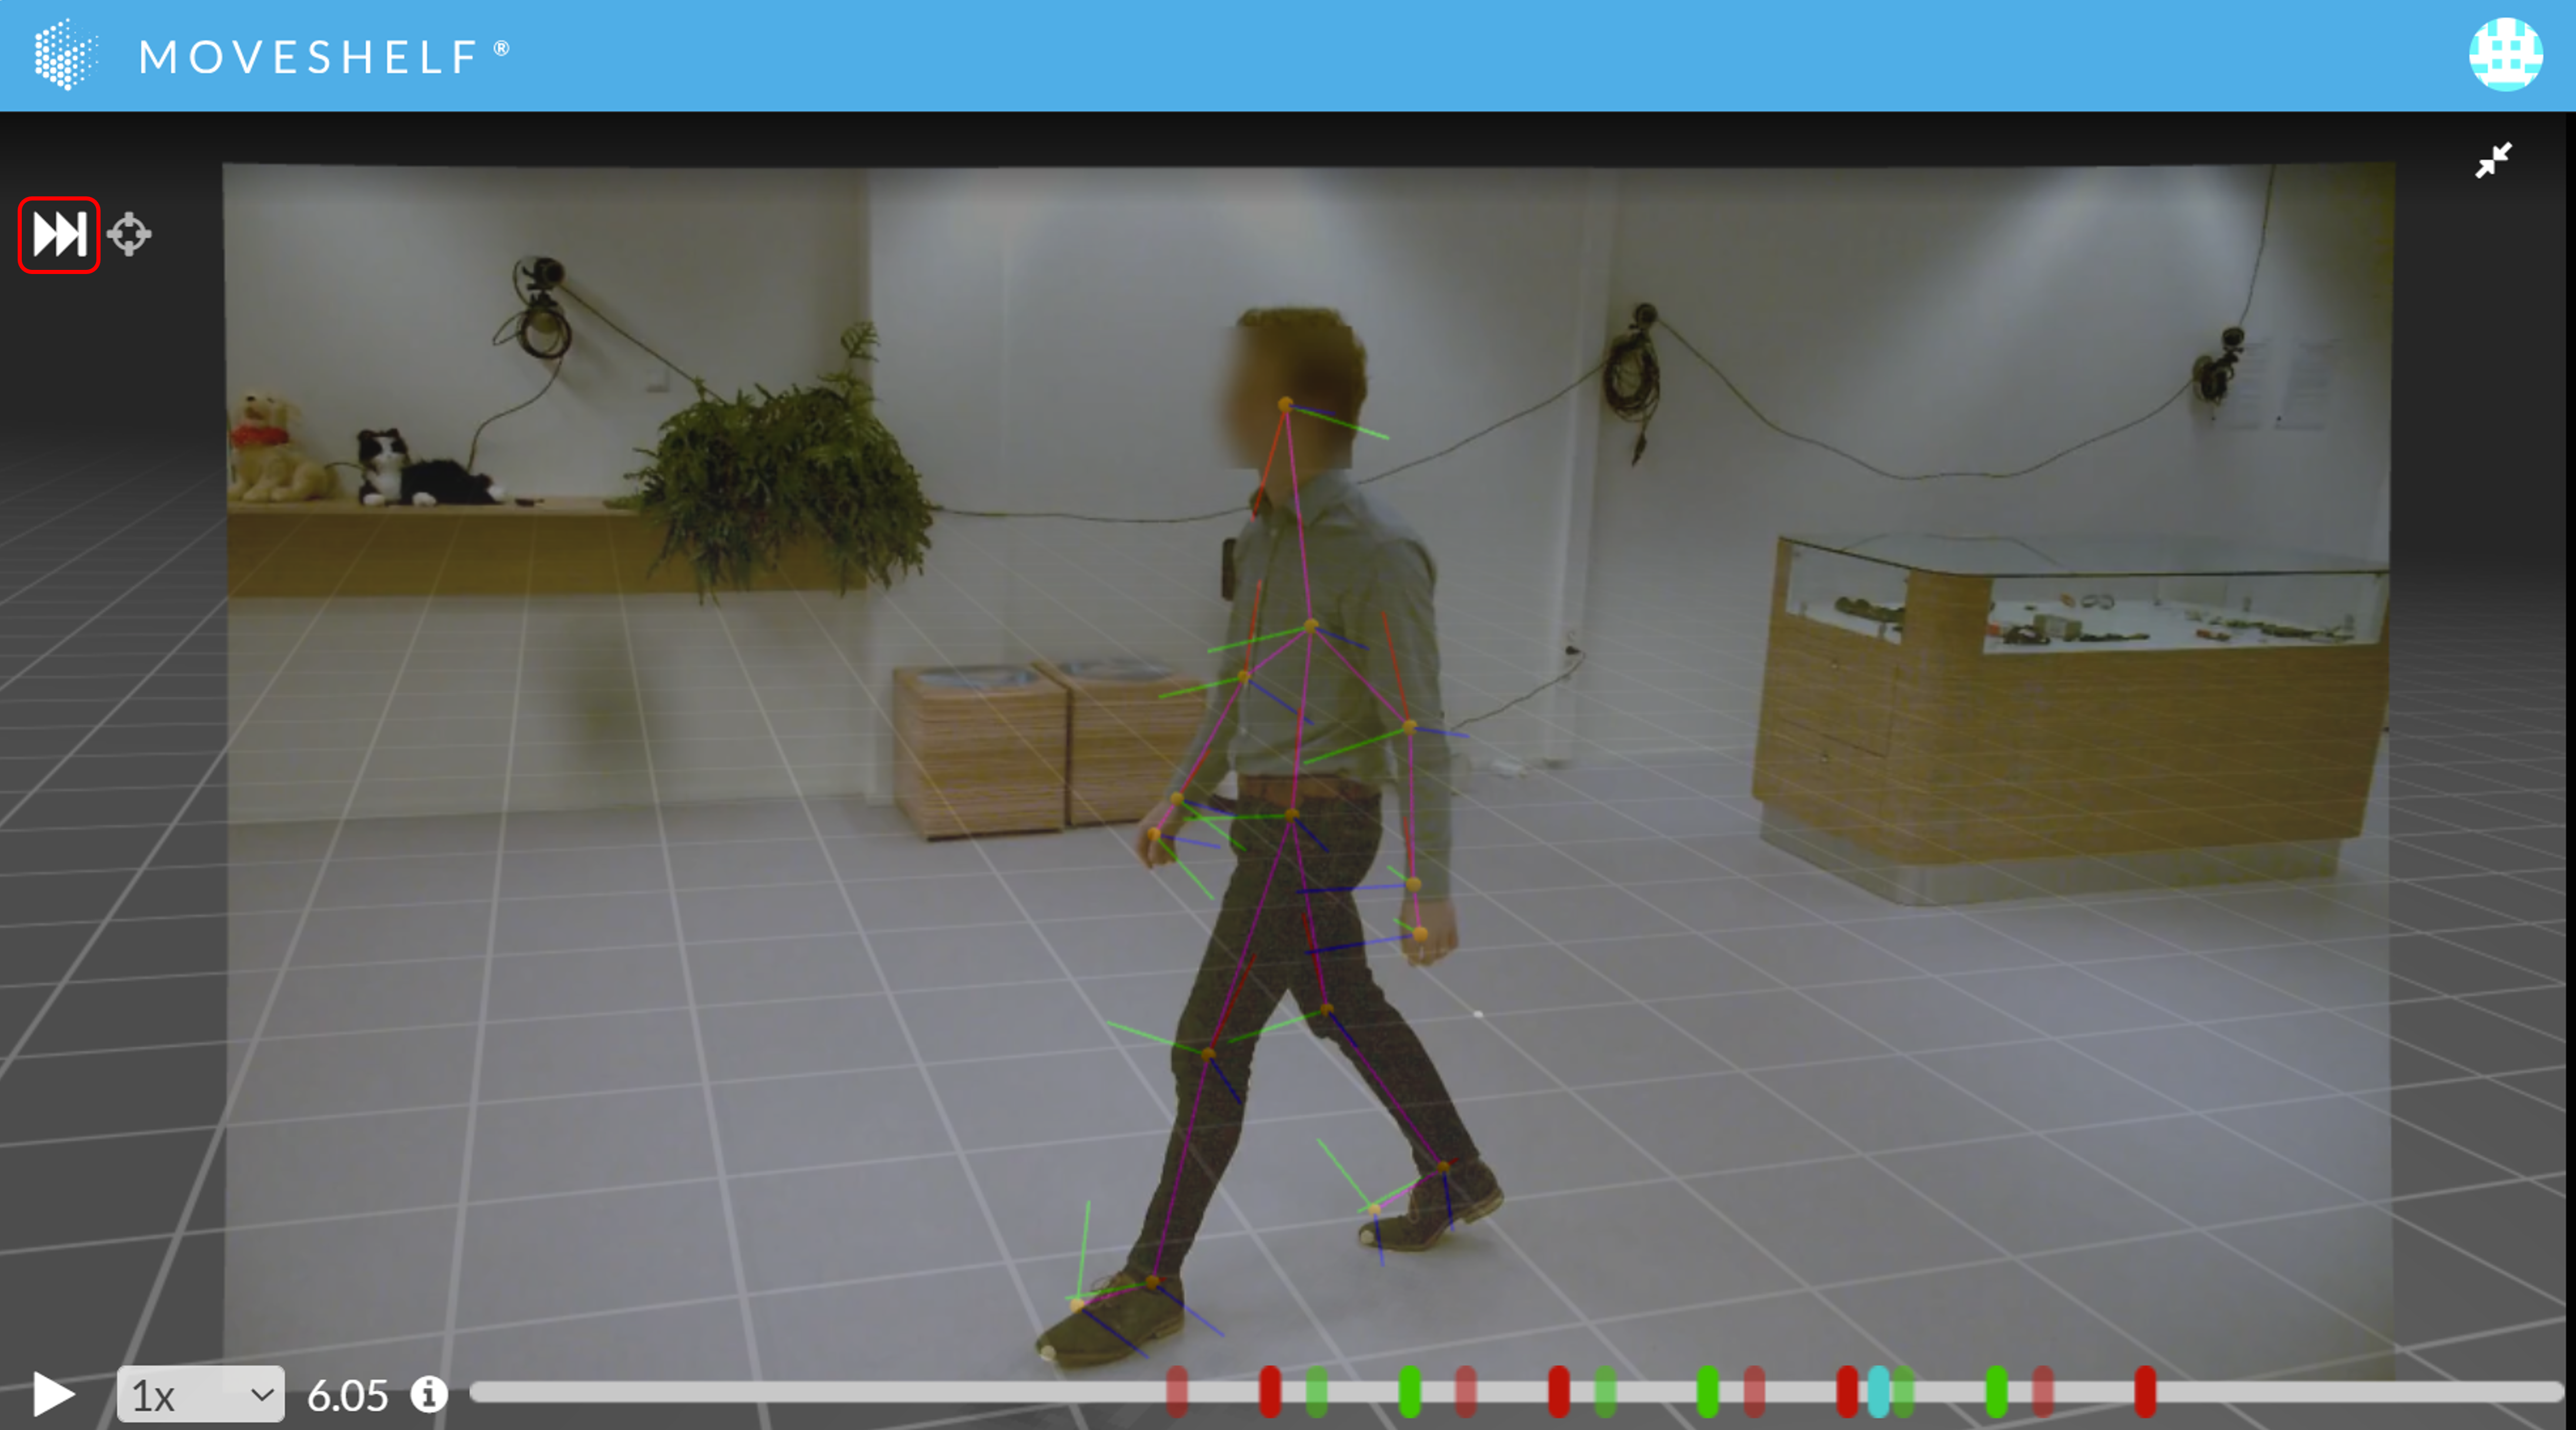
- Click on the 'skip to next/cycle video overlay' icon in the top left corner of the 3D player to visualize the first video of the trial on top of the 3D avatar.
- Continue to use the 'skip to next' icon to cycle through the different videos. For each video, the 3D view will adjust to the camera calibration values that matches the video perspective. When you've cycled through all videos, the next click on the 'skip to next' button results in the 3D player not showing a video.
- 3D avatar overlay in video is available in both trials and reports, and can be viewed in split screen as well as full screen modes.
Goniometer

 This feature is optional and only visible to Enterprise customers with this feature enabled.
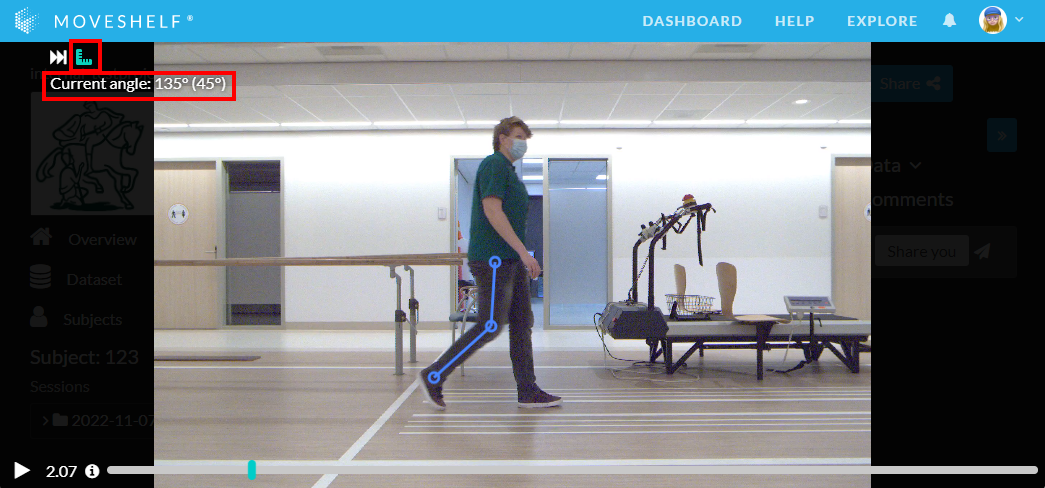
When you have a video open in full screen or in split screen, you can activate the goniometer in the top left corner of the video (see below). The goniometer allows you to manually drag lines on top of a video frame and results in giving you the 2D angle between these lines. The points can be individually dragged to the desired location and the angle between the three points is given in the top left corner. The first value shows the enclosed angle in degrees, and the second value is 180°-the enclosed angle.
SAGA ruler

 This feature is optional and only visible to Enterprise customers with this feature enabled.
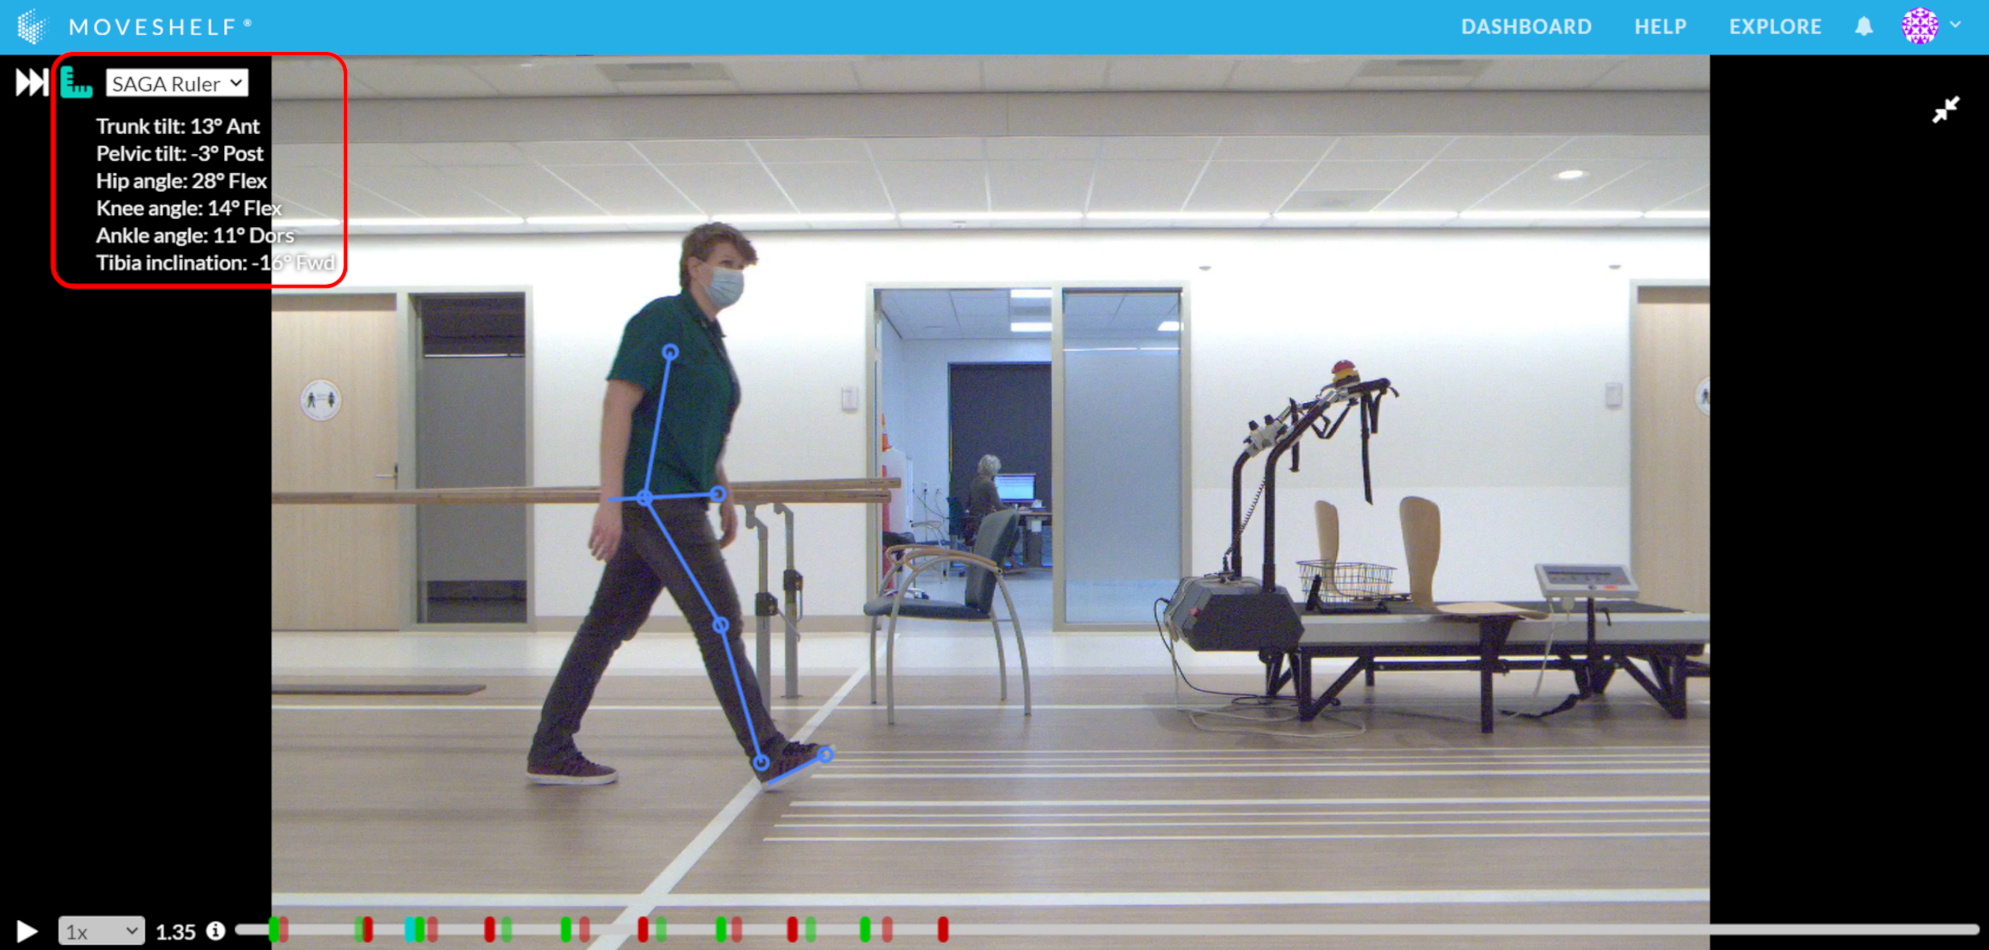
SAGA ruler stands for “basic SAgittal GAit ruler”. When you have a video open in full screen or in split screen, you can activate the SAGA Ruler in the top left corner of the video (see image below). It allows you to drag lines on top of a video frame, resulting in 2D joint angles.
First, drag the ankle, knee, and hip circles to place them on top of the corresponding joints. Then, rotate the trunk, pelvis, and foot lines to put them in the correct angle. Make sure the circles for the pelvis and foot lines are facing forward in the walking direction (as shown in the picture below). You can also move the entire model by placing the cursor on one of the lines and dragging.
In the top left corner you’ll see the following angles:
- Trunk tilt (Angle between trunk and global vertical axis)
- Pelvic tilt (Angle between pelvis line and horizontal axis)
- Hip flexion (Angle between upper leg and perpendicular line from pelvis line)
- Knee flexion (Angle between upper and lower leg)
- Ankle dorsiflexion (Angle between lower leg and foot line)
- Tibia inclination (Angle between lower leg and global vertical axis)


