 Search Knowledge Base
Explore data

Every user has his own personal homepage, called ‘Dashboard’. Your dashboard holds an overview of all projects of which you are a member.
Click on the Moveshelf logo or click on ‘Dashboard’ in the menu bar on top of the page to navigate to your personal overview of projects.
Dark/Light theme
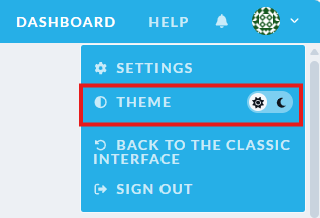
Moveshelf uses light mode by default, but you can switch between light and dark mode at any time using the Theme option in your profile menu. To change the theme:
- Click your profile avatar in the top right corner.
- Use the Theme toggle in the menu to switch between light mode and dark mode.
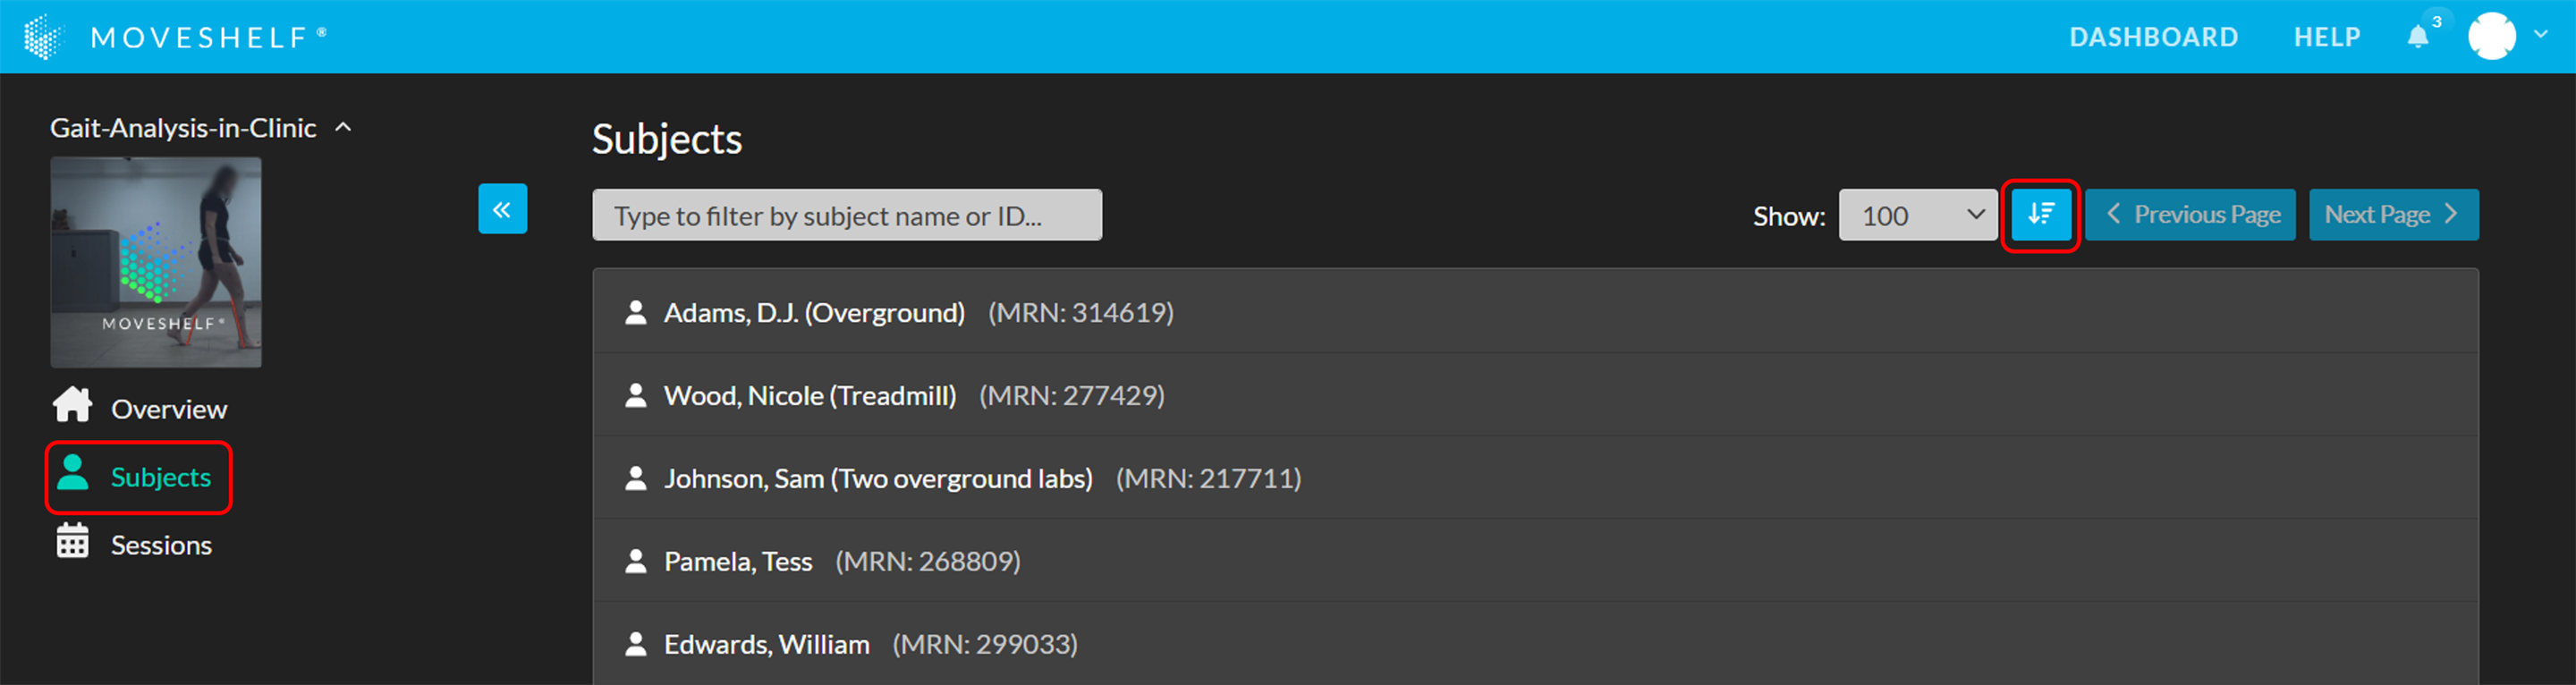
Subjects overview
Sessions overview
You can open a session by clicking on the corresponding row. To open a session in a new browser tab, right-click the item and select “Open link in new tab”. If not all columns fit on the screen, a horizontal scroll bar is available below the table, hold the Shift key while using the mouse wheel to scroll sideways in the table.
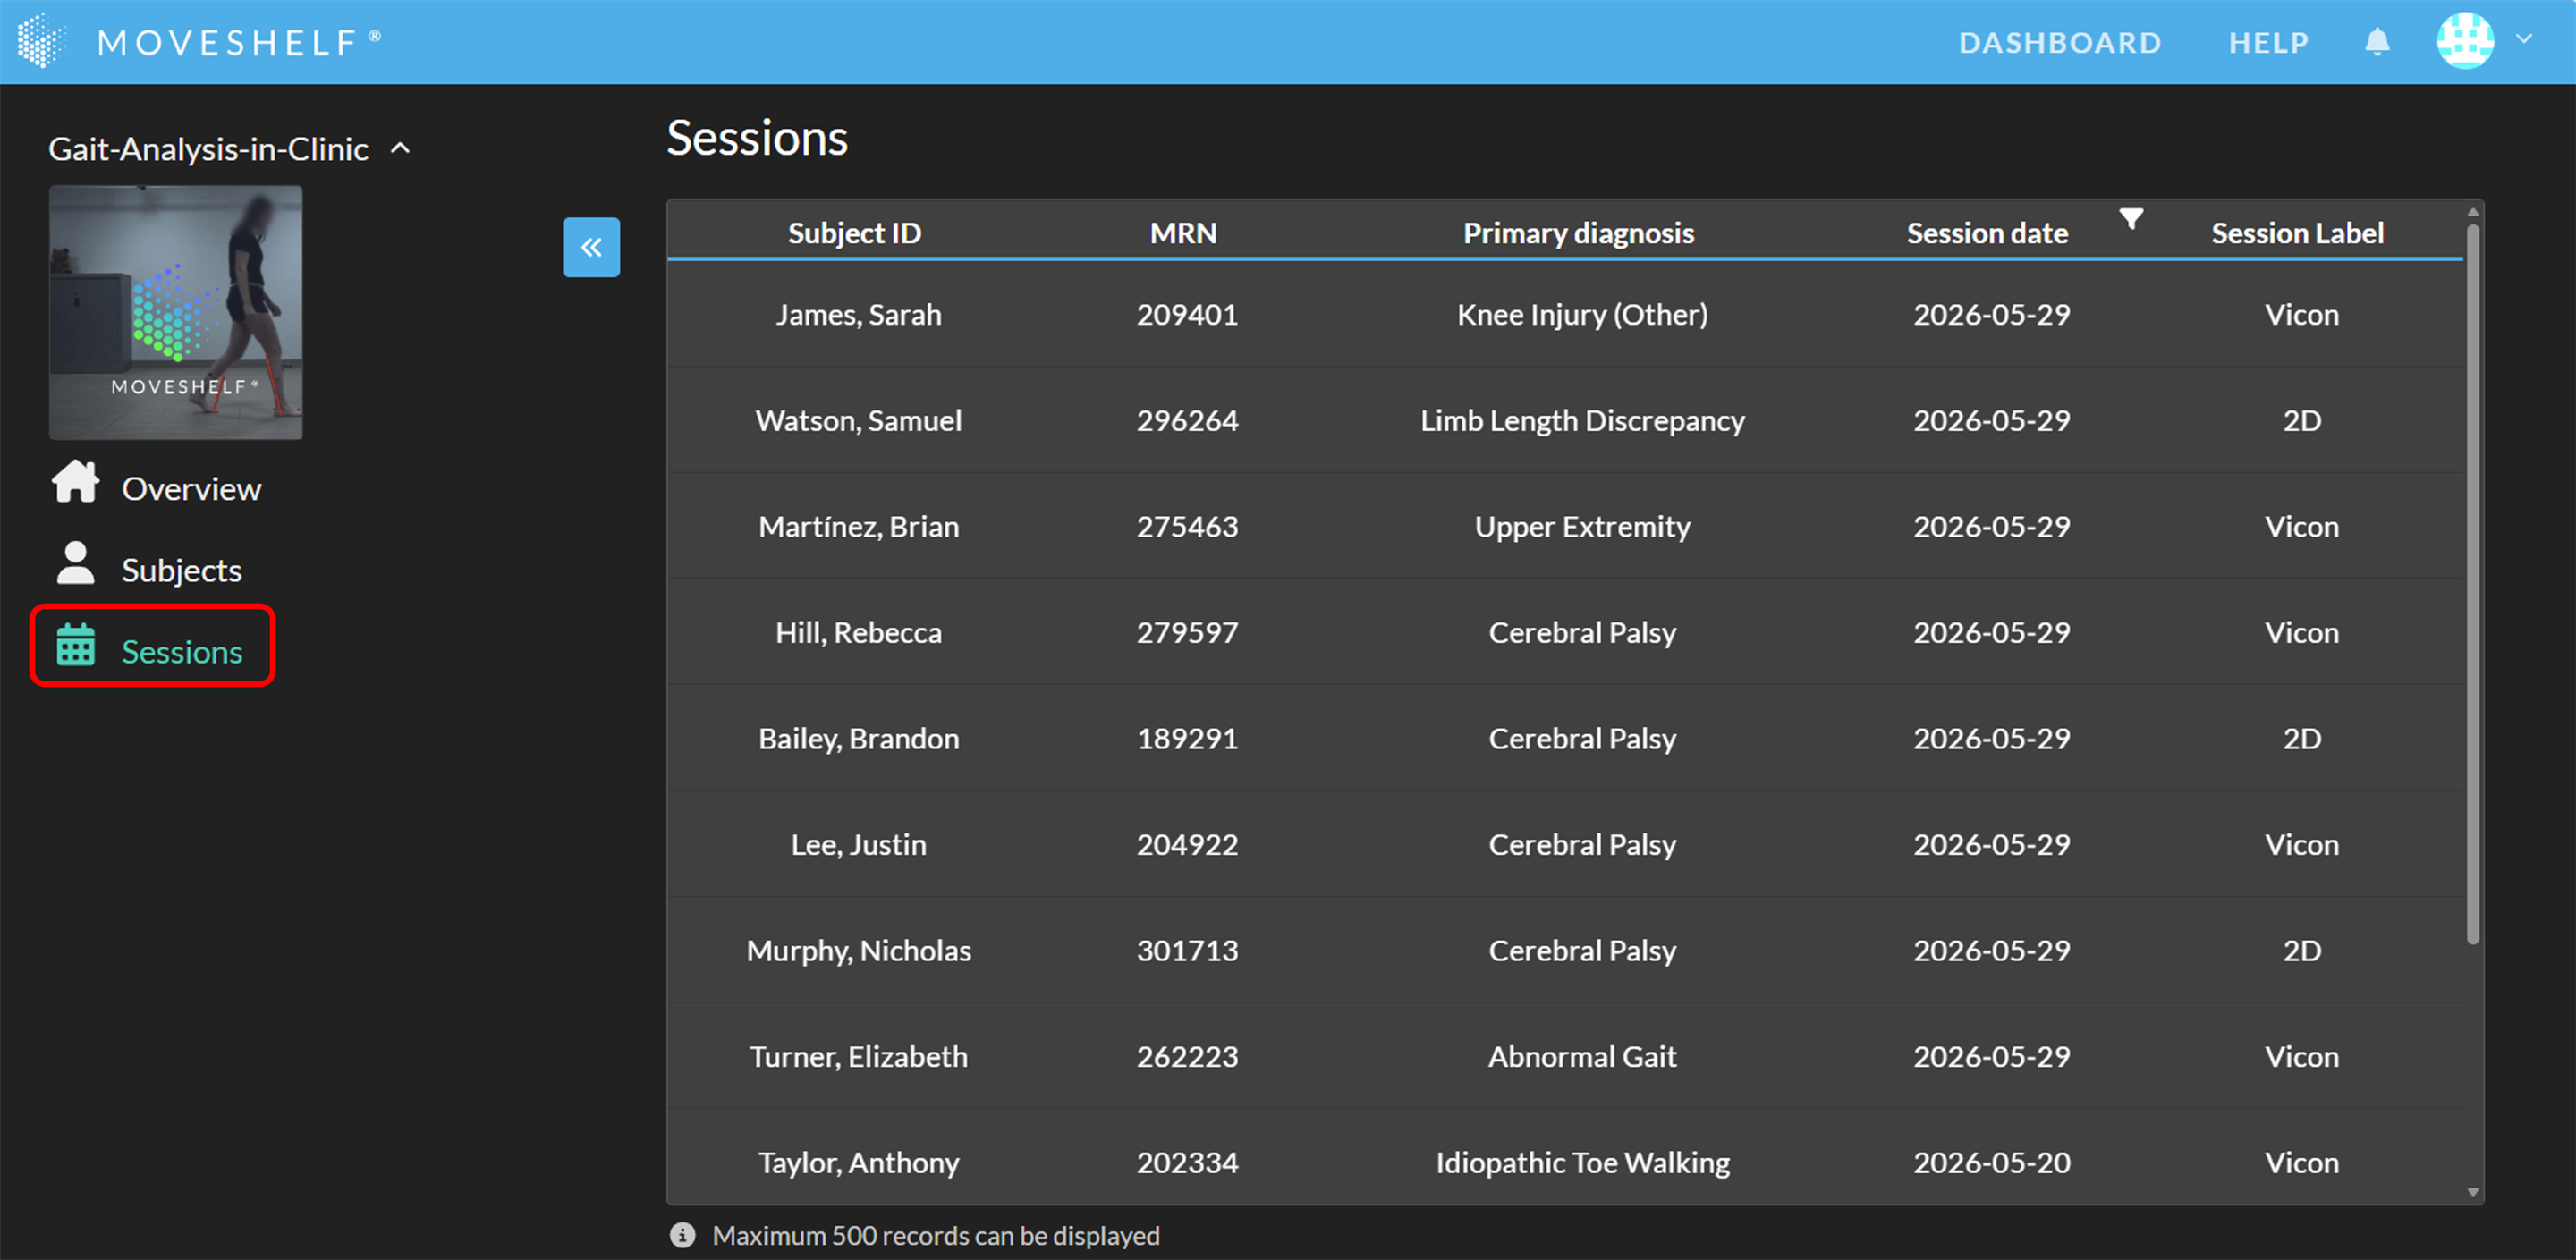
 By default the sessions overview includes the following fields: "Subject ID", "EHR ID", "Diagnosis", "Session date", and "Session label". Which subject, session and condition metadata fields are displayed can be customized according to your preferences. Please contact Moveshelf support to help you with setting your preferences in your session overview.
For condition metadata fields, only conditions with a value will be shown; any condition without a value for that field will not appear in the overview.
By default the sessions overview includes the following fields: "Subject ID", "EHR ID", "Diagnosis", "Session date", and "Session label". Which subject, session and condition metadata fields are displayed can be customized according to your preferences. Please contact Moveshelf support to help you with setting your preferences in your session overview.
For condition metadata fields, only conditions with a value will be shown; any condition without a value for that field will not appear in the overview.
Filter the sessions overview
By default, the overview is filtered by session date to show all sessions within the last 10 weeks. You can edit the session date filter by clicking the session date filter icon (see video below).When hovering over the headers of the table, filter icons will appear next to the headers. Click a filter icon to add a filter for that column. Please note that:
- When a filter is active, the filter icon next to the header remains visible (also when you are not hovering).
- The "(Select all)" checkbox can be used to select / deselect all options at once.
- The "(Blanks)" checkbox can be used to show all sessions with that field empty.
- Filters are available for date and dropdown fields.
- You can apply multiple filters simultaneously to refine your search.
To remove a filter, click on the filter icon, and select "Clear filter".
Filter settings are shown in the URL. This means you can bookmark the page to quickly get to the same filter settings again.
Subject home page
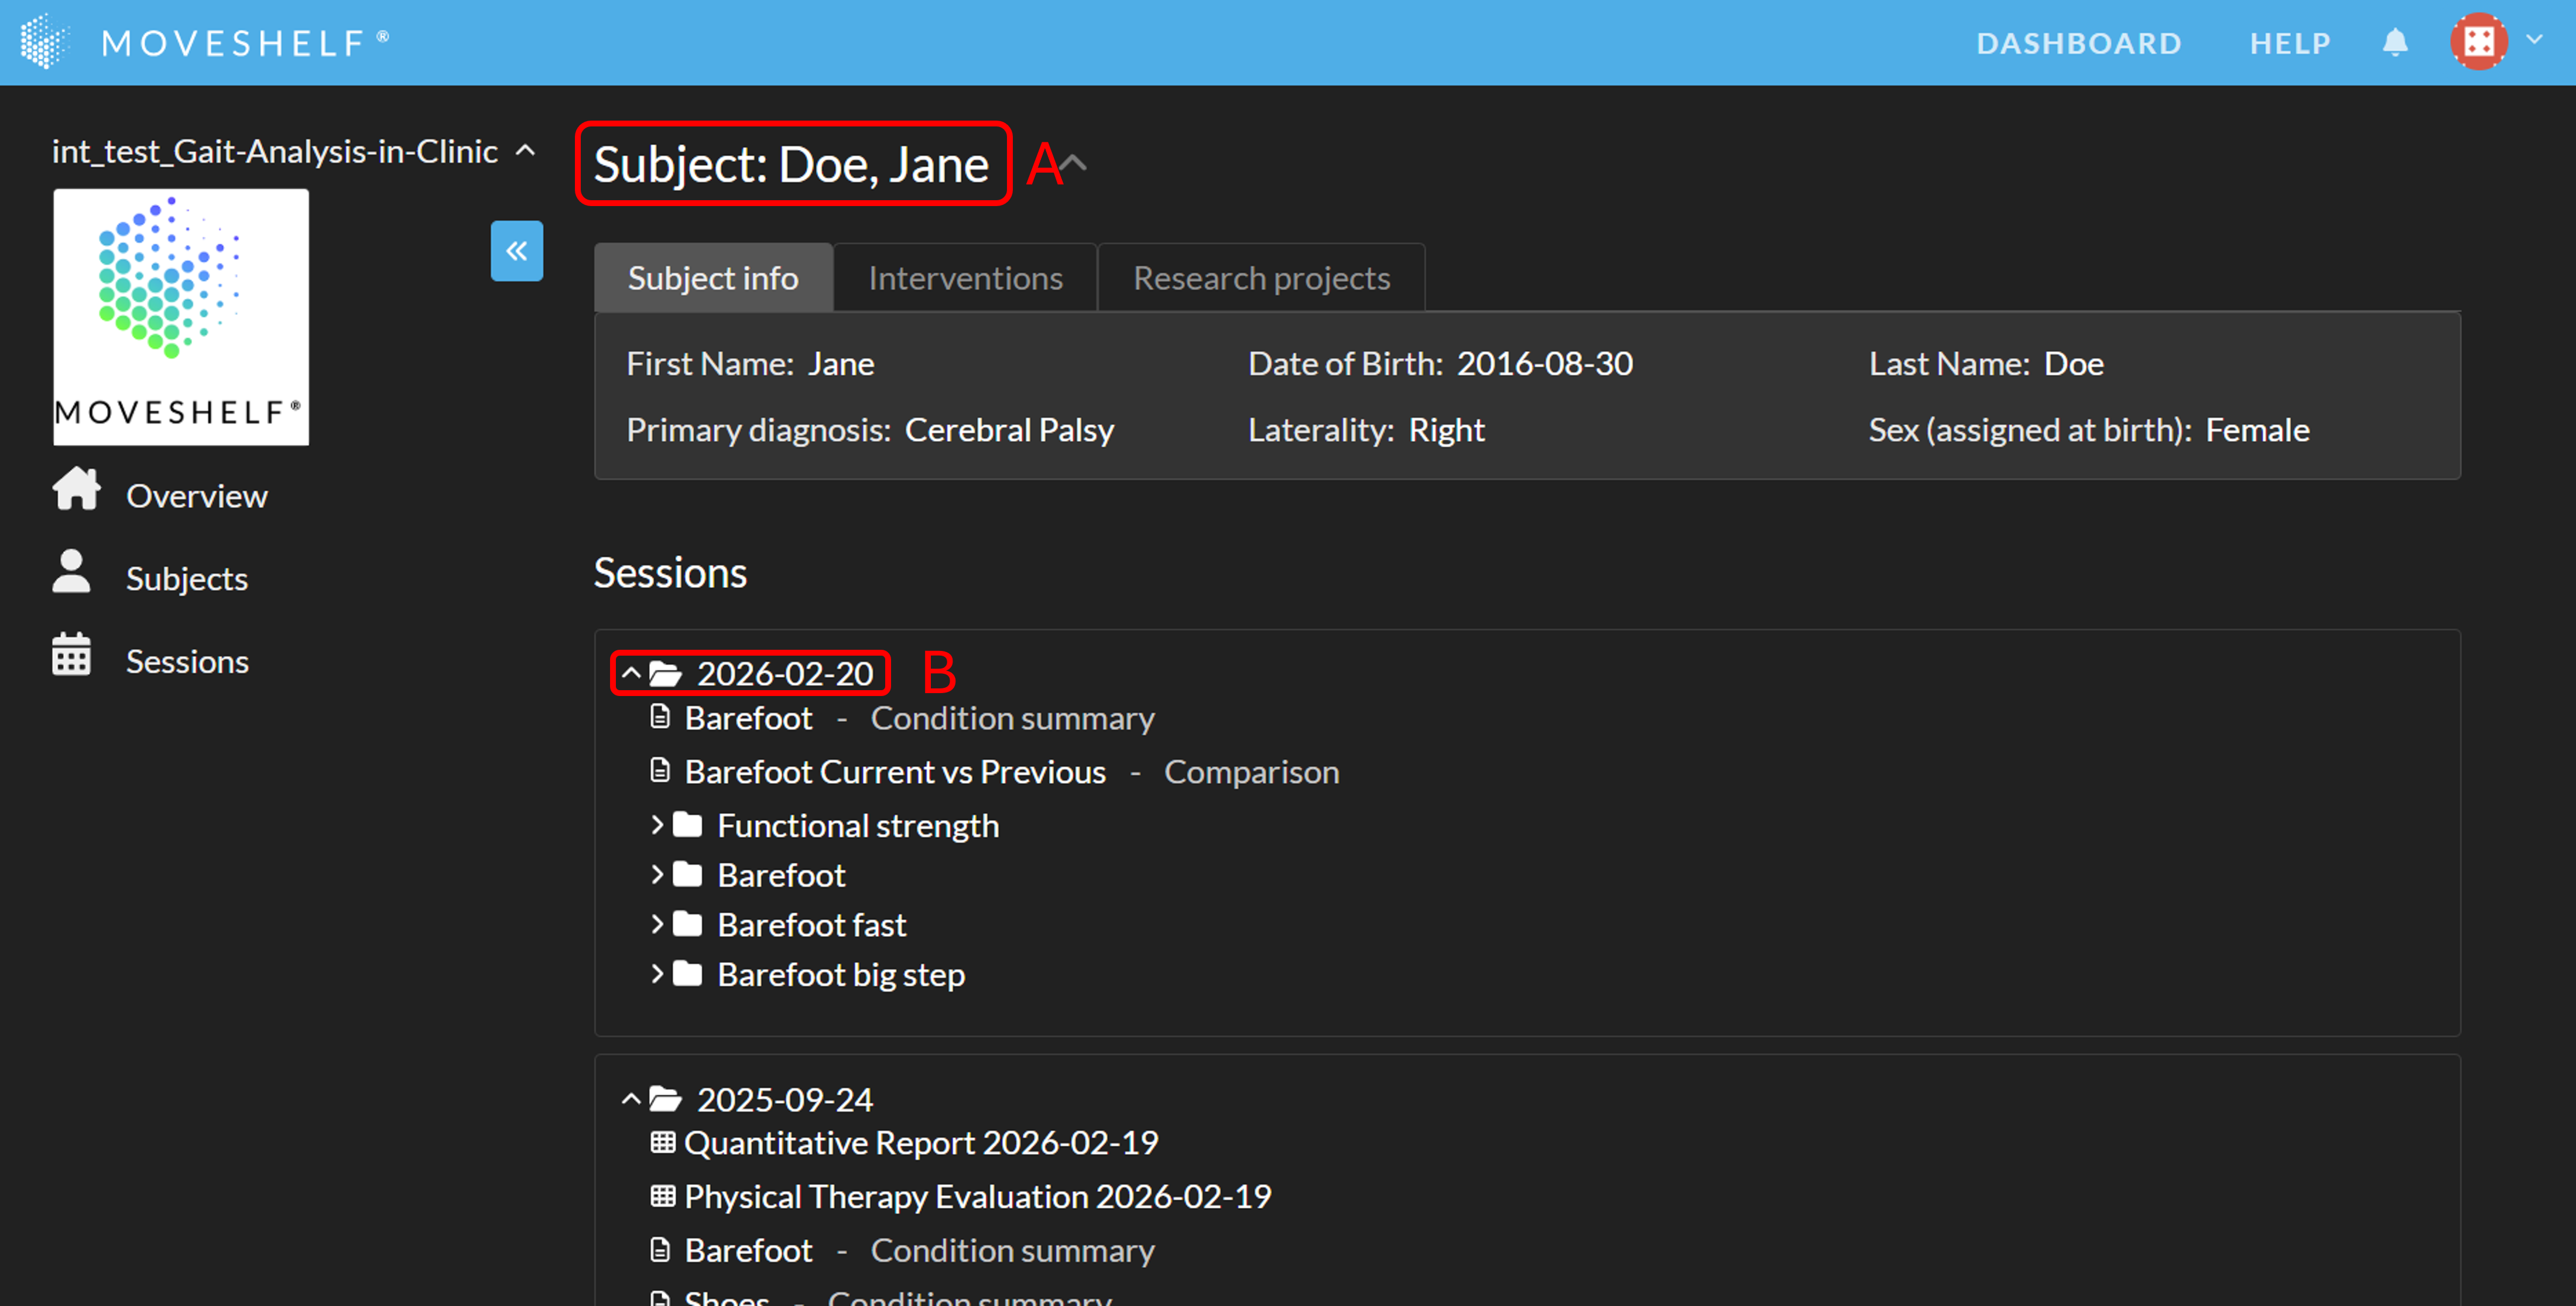 If you have entered a Moveshelf subject page through URL's from the EHR (deeplinks), you will only be able to see this subject and its data. You will not be able to navigate away from this subject. This feature is present for your organisation when you see a ‘shield’ icon next to the subject’s name.
Subject information
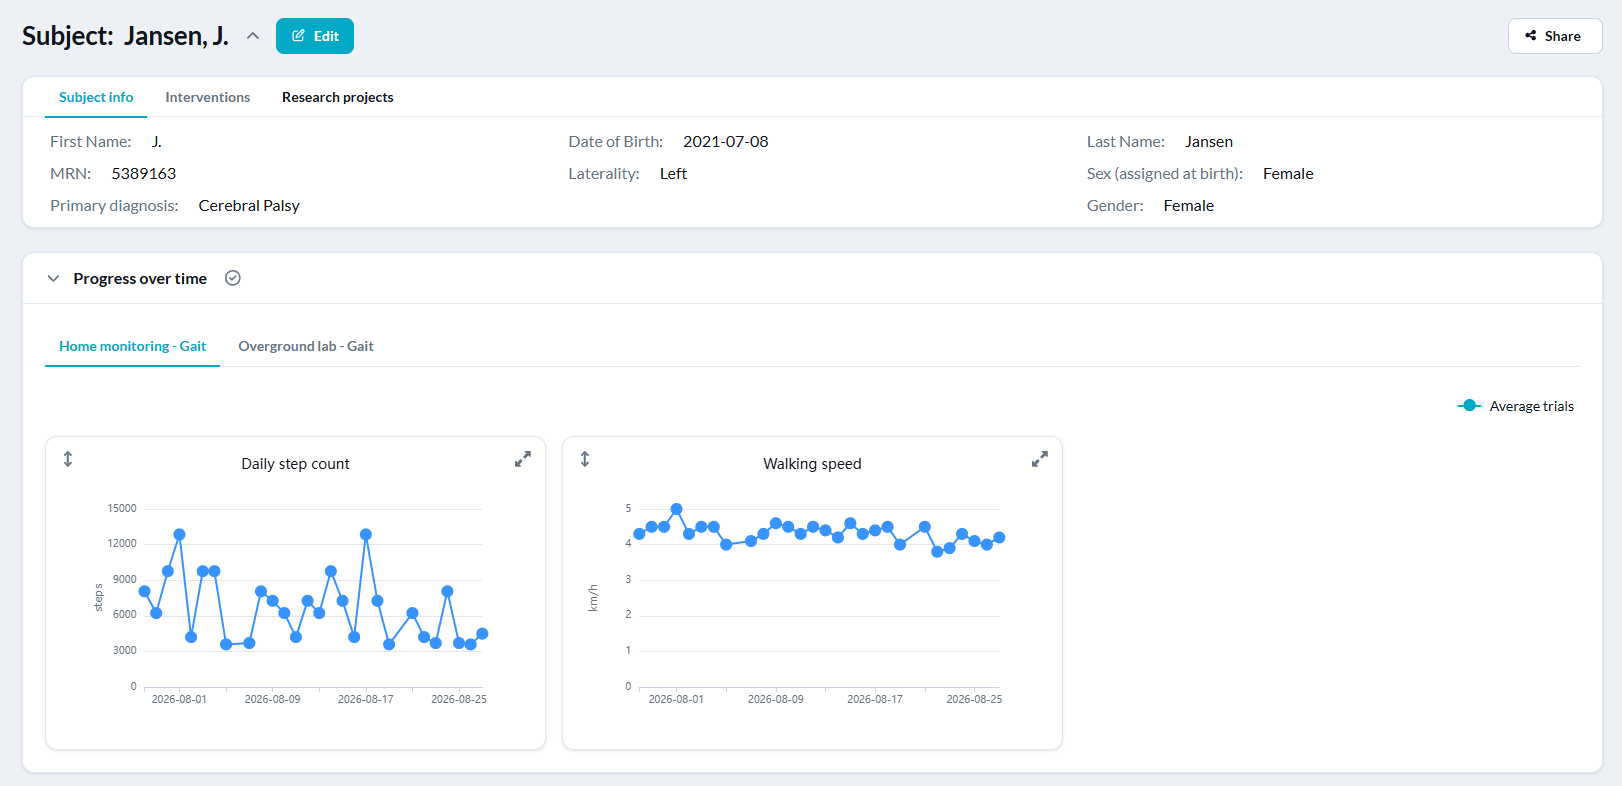
On the top of the subject home page entered subject information will be displayed. Information on the other tabs (e.g. Interventions and/or Research projects) will only be present if the lab operator populated information in these sections. Displayed tabs and content in the tabs depends on metadata configuration.- Click on ‘Subject info’ to view the specific subject information.
- Click on ‘Interventions’ to view the shared interventions' notes.
- Click on ‘Research projects’ to see research details.
Progress over time
In case "Progess over time" graphs are configured in the project, you will see a "Progress over time" header underneath the subject information, which can be expanded by clicking the header (B in the image above). See Progress over time for more information.View Movement data
Below the subject information, movement data is displayed. The movement data is ordered by when the subjects' sessions were created. The session includes all the session metadata (if present), all conditions that have been captured and subsequently each condition includes the trials that have been performed. When you click on the session-date-header (C in the image above), the session will be opened.Session information
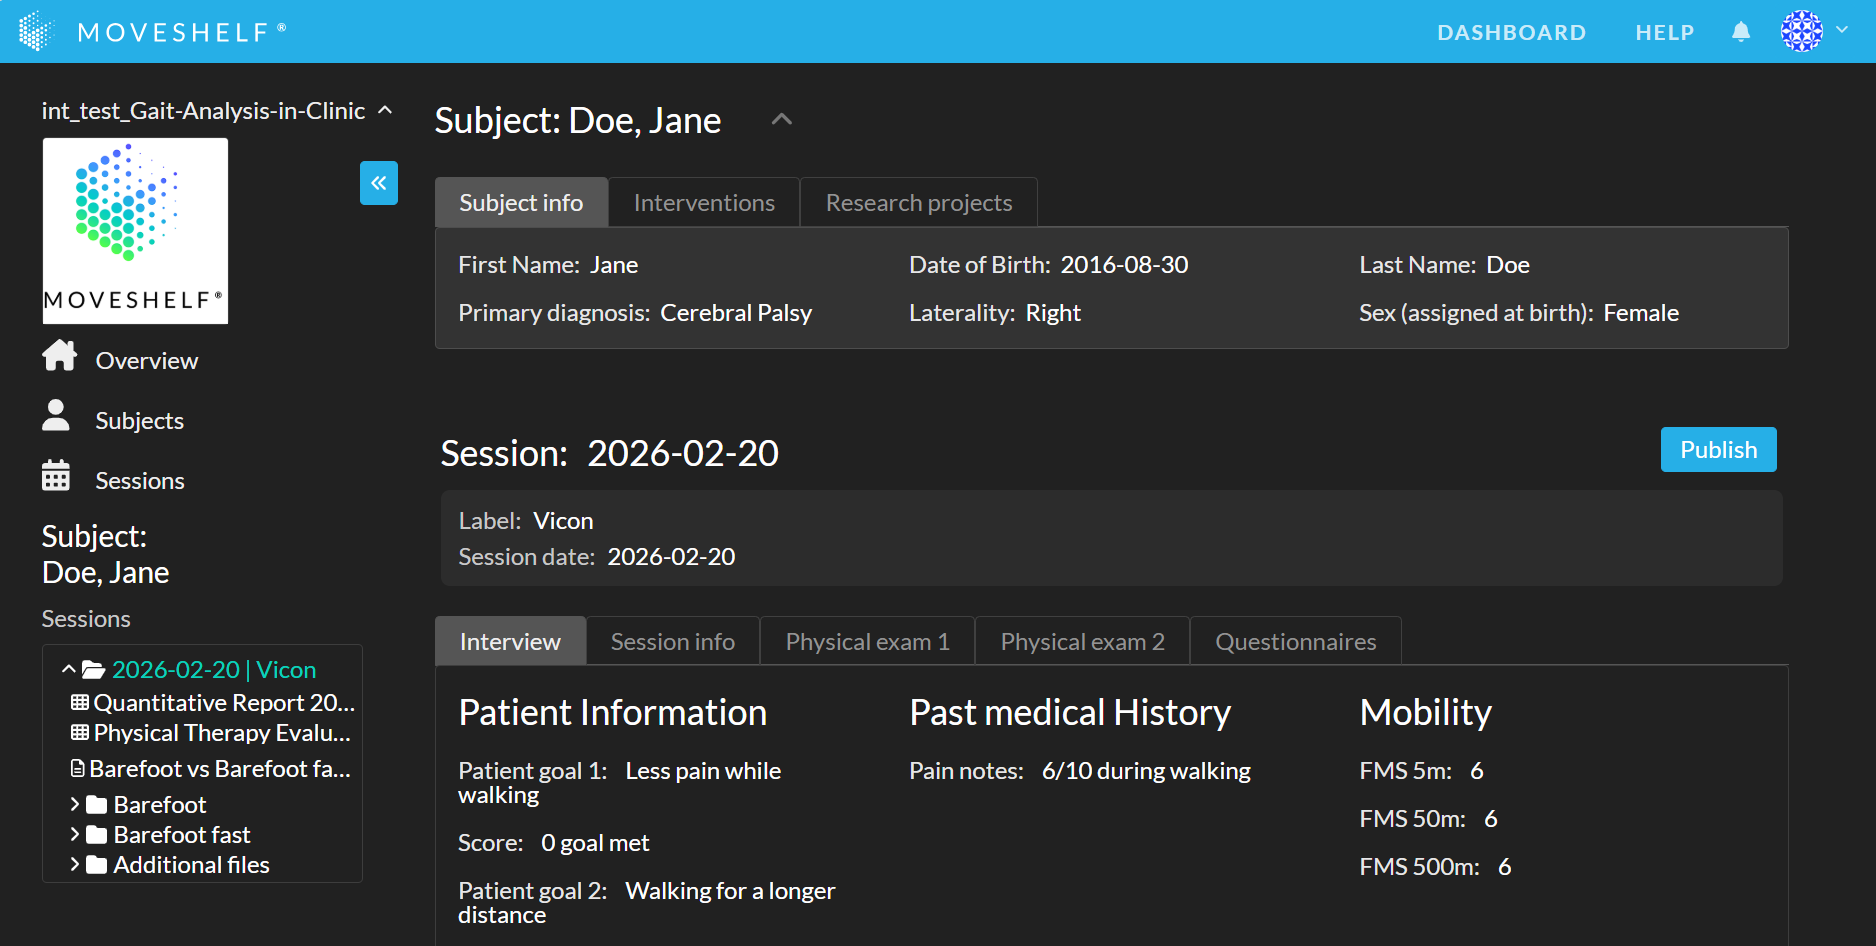
In case session metadata is configured in the project, session metadata is displayed in the session. Displayed content depends on the metadata configuration.- Click on ‘Interview’ to view the patient information, past medical history and mobility.
- Click on ‘Session info’ to view the session information such as the referring physician.
- Click on ‘Physical exam 1’ or ‘Physical exam 2’ to see exam(s) details.
- Click on ‘Questionnaires’ to see questionnaires' details.
Navigation menu
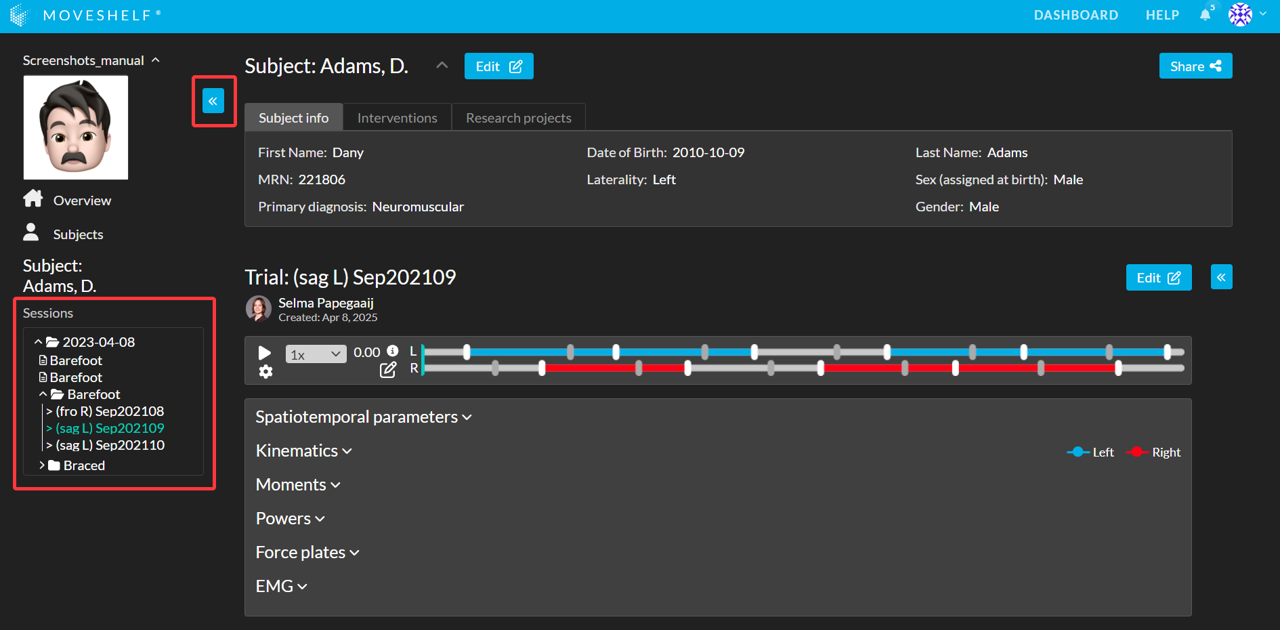
You can hide the navigation menu with the blue ""<<" button at the top left of the page, to free up more space to view your data.
Trials
- 2D videos
- 3D player
- Gait parameters
- Kinematics
- Moments
- Powers
- Force plate data
- EMG
- EMG consistency
The trial you are viewing is highlighted in the navigation menu on the left side of the screen. Within a trial, click on the headers of the data type to expand the section.
If 3D data (avatar) is available for the trial, it will appear in the panel on the right side of the screen. This right sidebar is collapsed by default—to view it, click the blue “<<” button on the right.
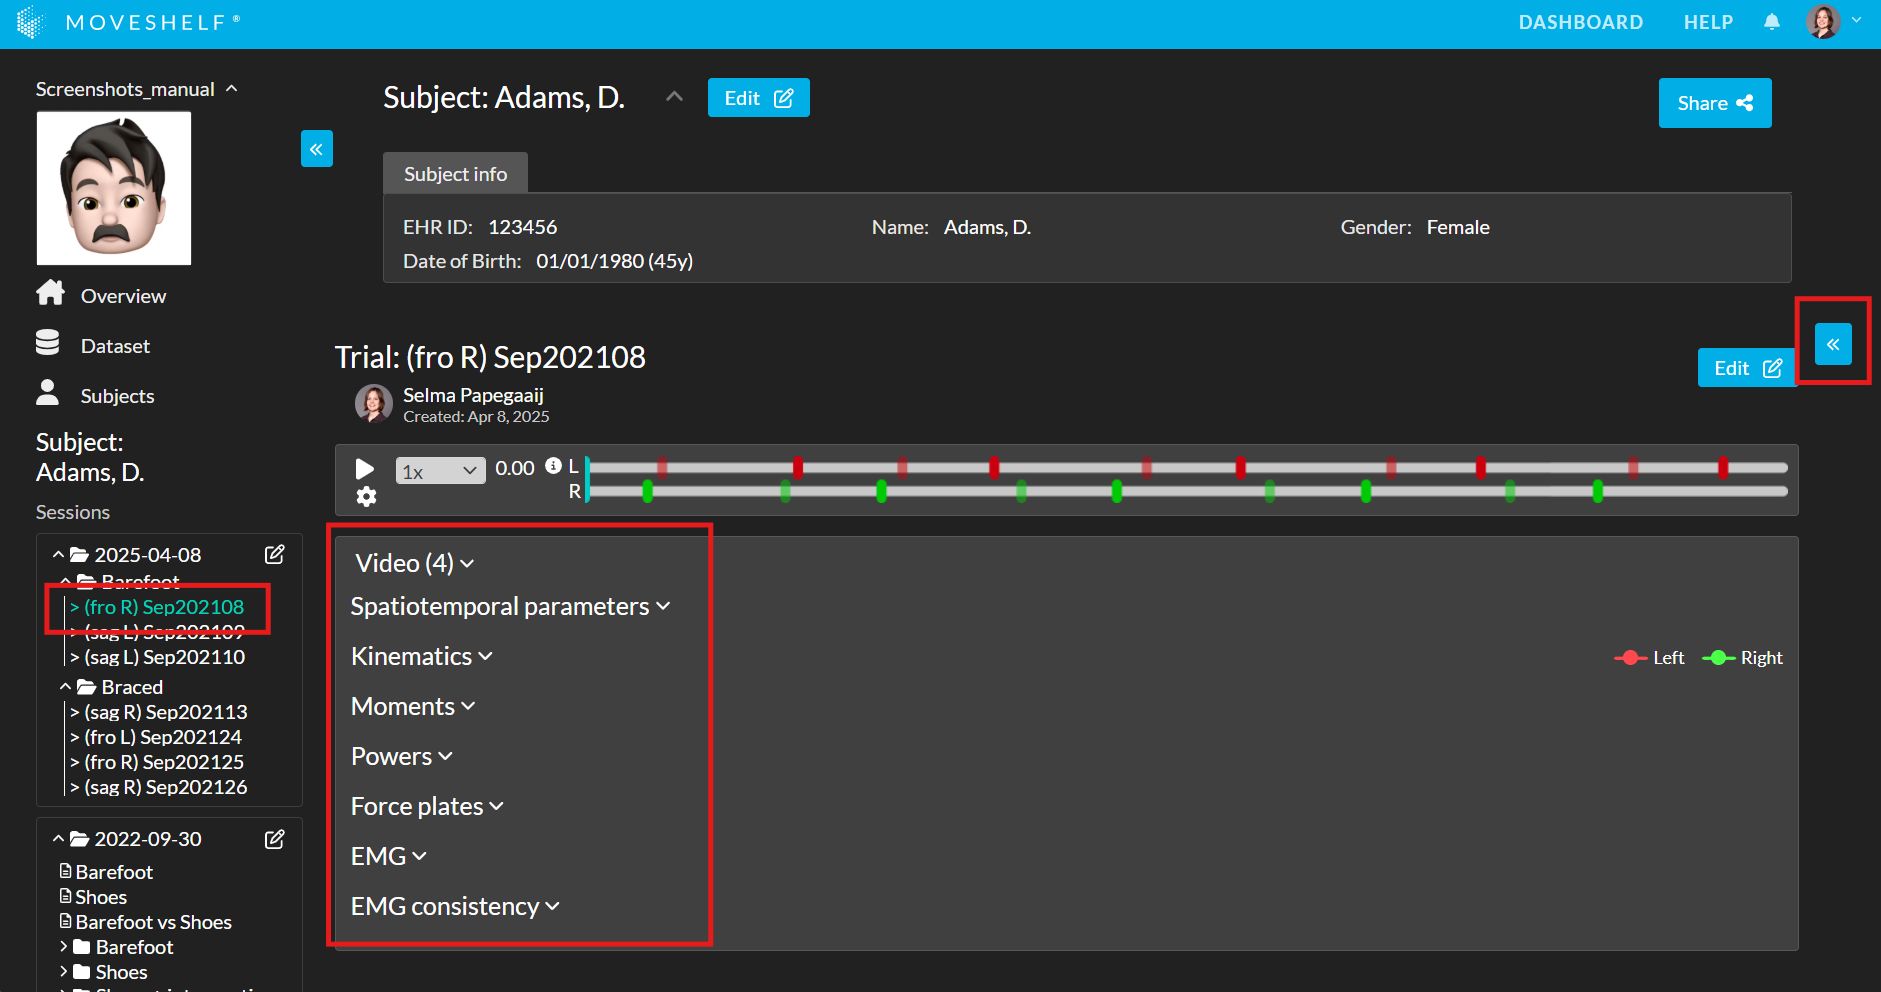
For more info about graph features, go to interactive graphs.
Reports
Please note, the report visualization is saved to make the report load faster. If any changes are made to the included trials, see the section update report visualization for instructions on how to update it.
Explore data in the report
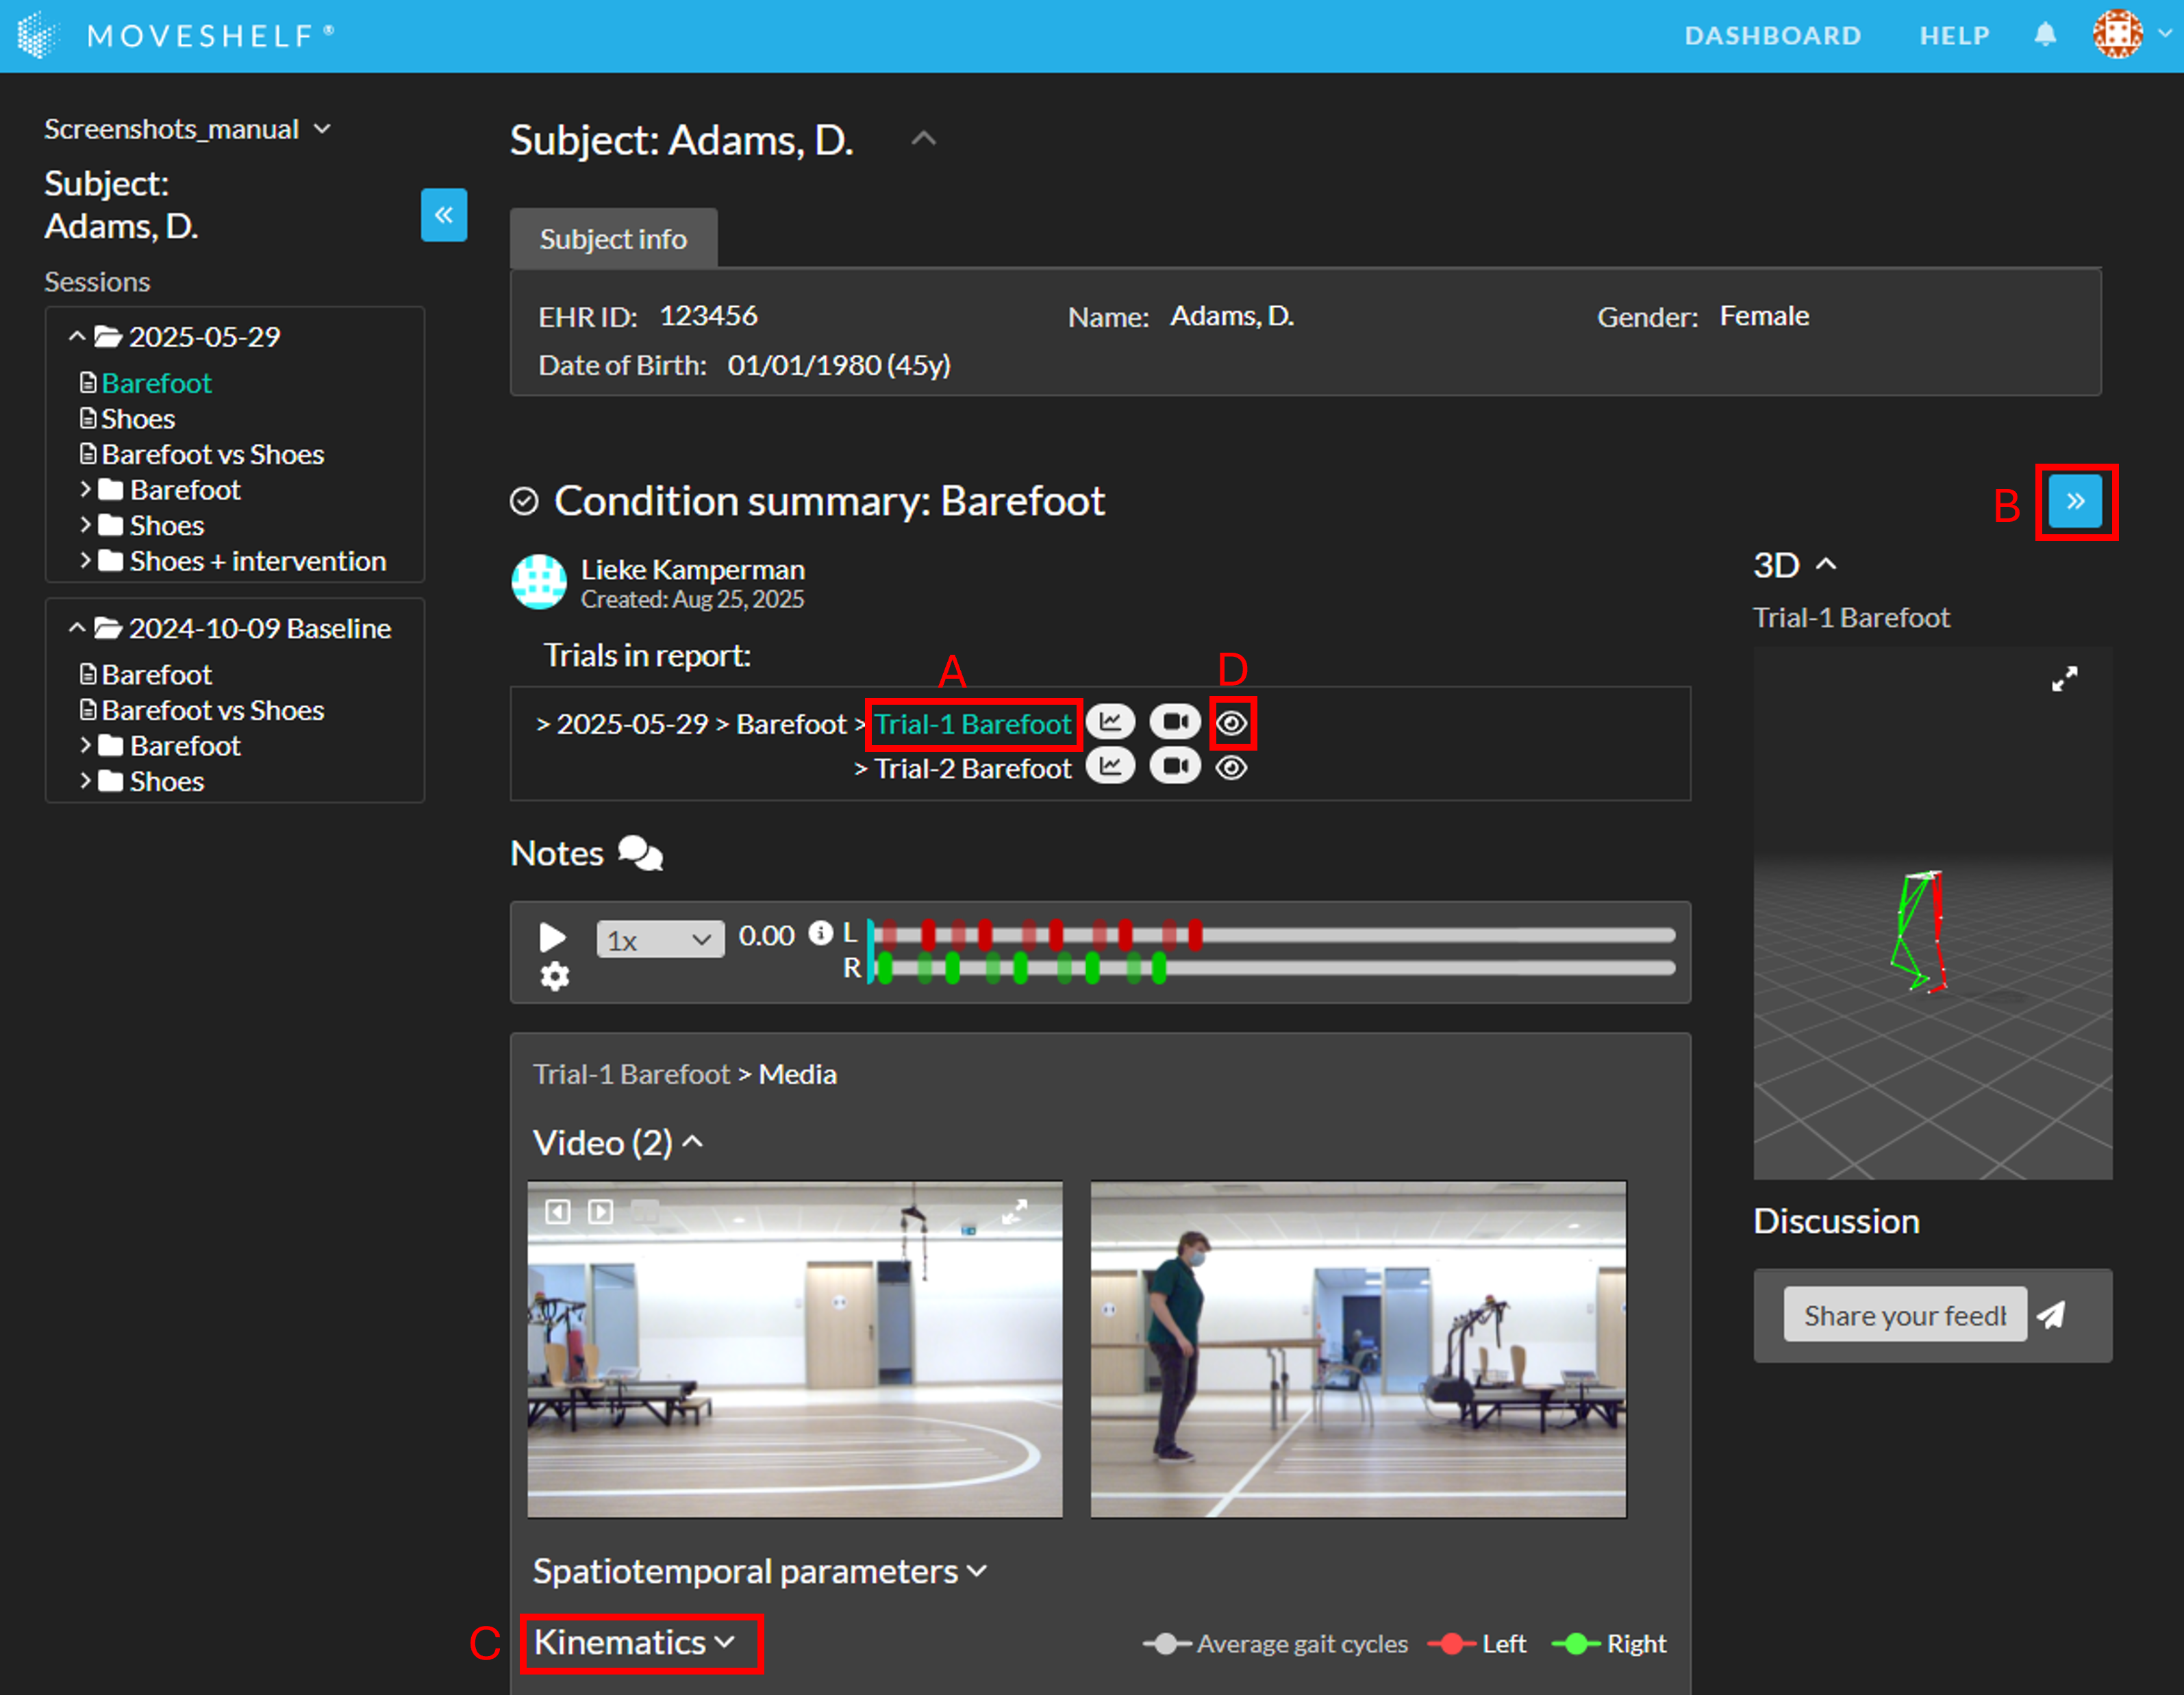
- To view the 2D video, 3D player and/or EMG consistency graphs of one of the trials, click on the trial name below the header ‘Trials in report:’ (see A in screenshot below).
- The 2D videos will be displayed just below the playbar.
- The 3D player will be shown on the right side of the page. If the right sidebar is hidden, click "<<" to open it (see B in screenshot below).
- The EMG consistency graphs will be displayed at the bottom of the report in the EMG consistency chart group (see C in screenshot below).
- To open other types of data in the report (e.g., Kinematics, Moments, Powers, EMG) click on the header of the data type you would like to view (see C in screenshot below).
- Click on the 'eye' icon to hide/show all gait cycles of a trial from the report (see D in screenshot below, or the video). Please note this feature only works for graphs with individual (non-averaged) gait cycles. For other graph interactions, see the section interactive graphs.
Explore data in the report:
 Show/hide trials in graphs in a report:
Clickable condition summary
This feature is optional and only visible to Enterprise customers with this feature enabled.
- By clicking on the condition header in the subject home page.
- By clicking on the condition header in the session home page.
- By clicking on the condition header in the navigation menu.
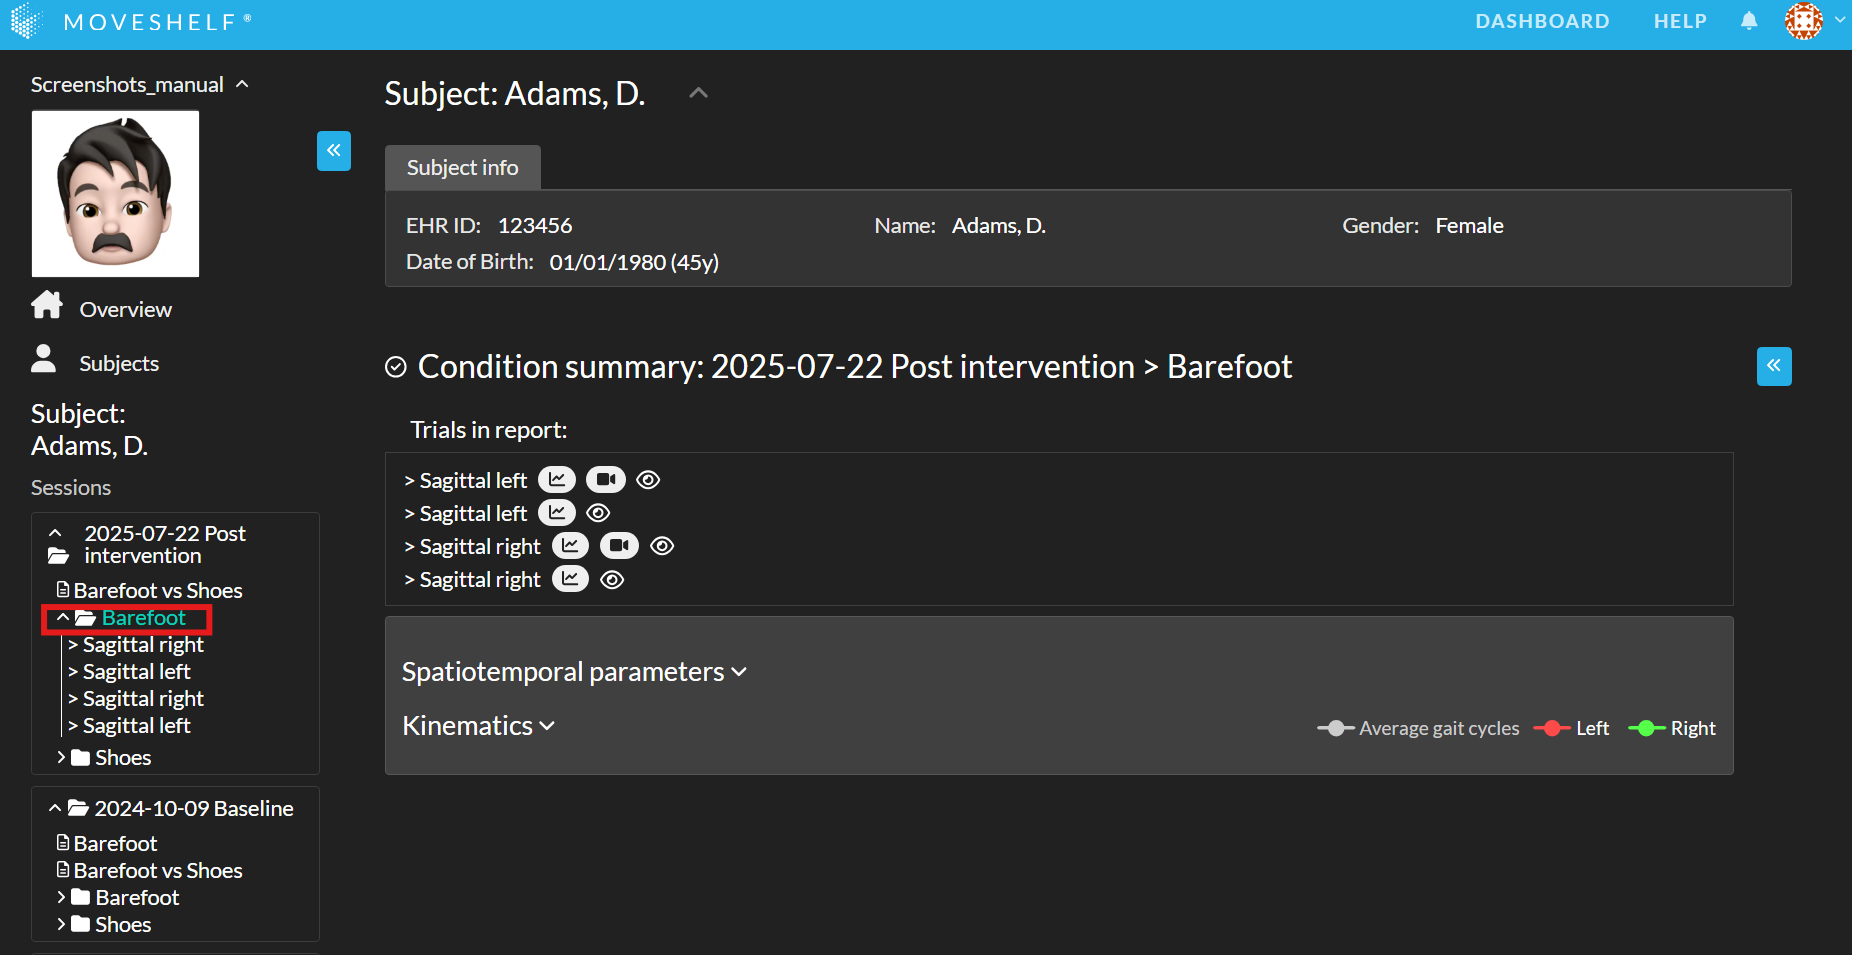 Please note, the clickable condition summary visualization is saved to make it load faster. If any changes are made to the trials within the condition, see the section update report visualization for instructions on how to update it.
Progress over time
This feature is optional and only visible to Enterprise customers with this feature enabled.
This section can be used to evaluate a patient's progress over time by plotting data from all sessions in one graph (see image below). The tabs and graphs can be configured to suit your needs. The following parameters can be plotted:
- Spatiotemporal parameters
- Session information like physical exam measures
- Daily step count
Each slightly transparent, unconnected dot represents one trial. Each solid, connected dot represents the average of all trials in a session. You can turn off the trial average by clicking the "Average trials" toggle.
Please note that in the image below you only see the trial average, since there is only one data point per session.