Go to the subject on the Moveshelf Information System (web). In the subject home page you will find an overview of all available sessions from this subject, including the uploaded sessions from the Mobile app. Open the session on the Moveshelf Information System (web) and you will see all trials that were included in the upload. This upload can have different datatypes: .mov, .txt and .csv files. There are two different ways to view this data:
- Trial view
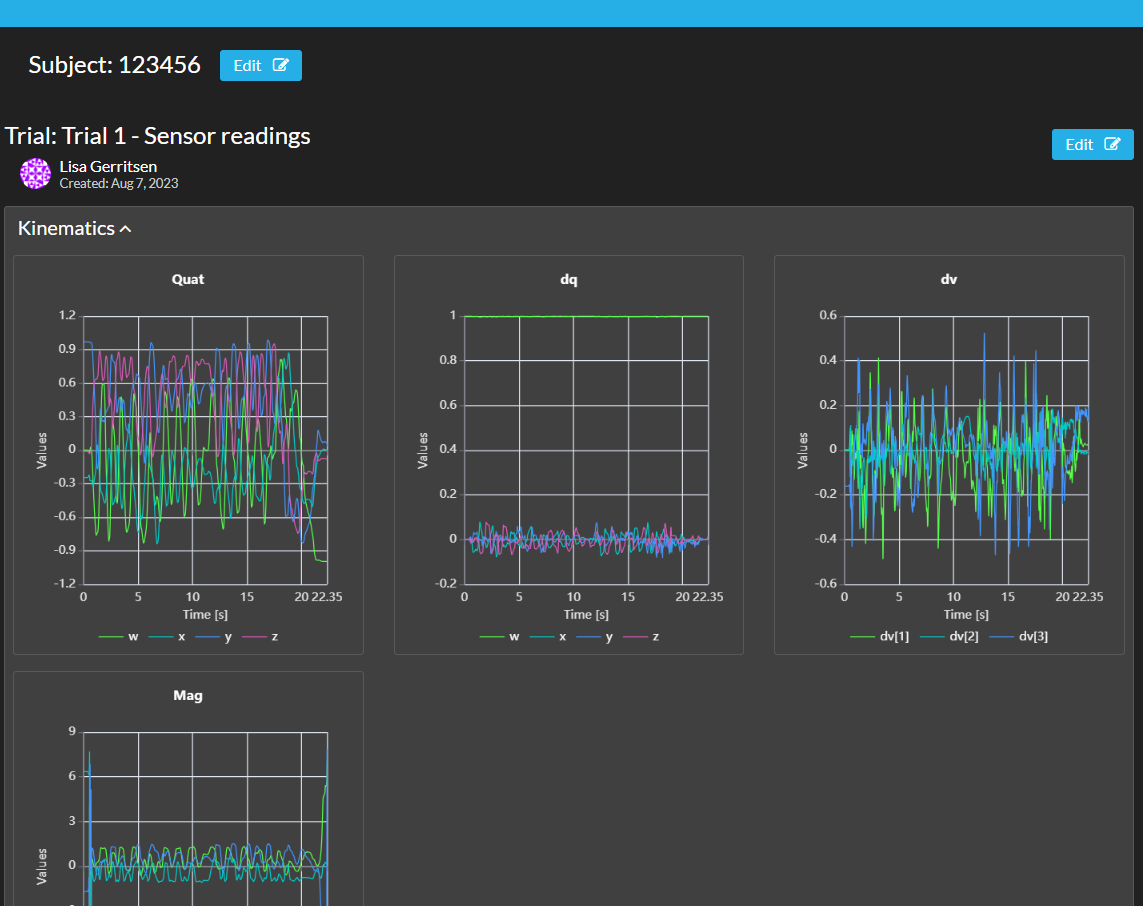
A trial can include a video or sensor data. The sensor data is displayed in graphs and the video can be viewed using the playbar on top. For more detailed information on how to view data on Moveshelf, please read
Playback controls for media and
Interactive graphs.
- Report view
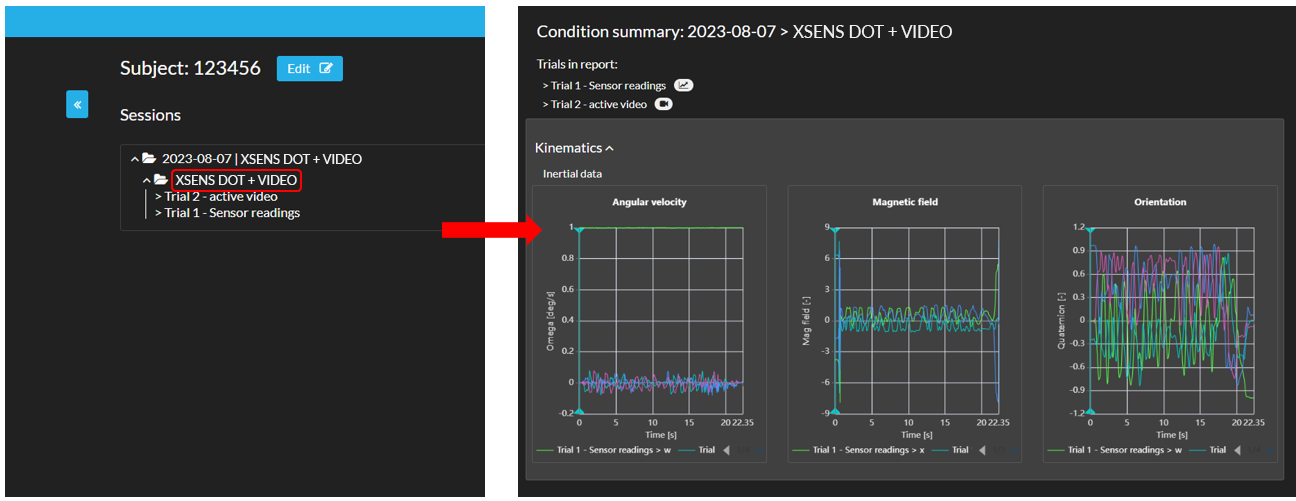
All trials from the same session and monitoring type are combined in a report, called the condition summary. To open a condition summary click on the name of the condition, visible in the subject home screen or in the left navigation bar (see image below).
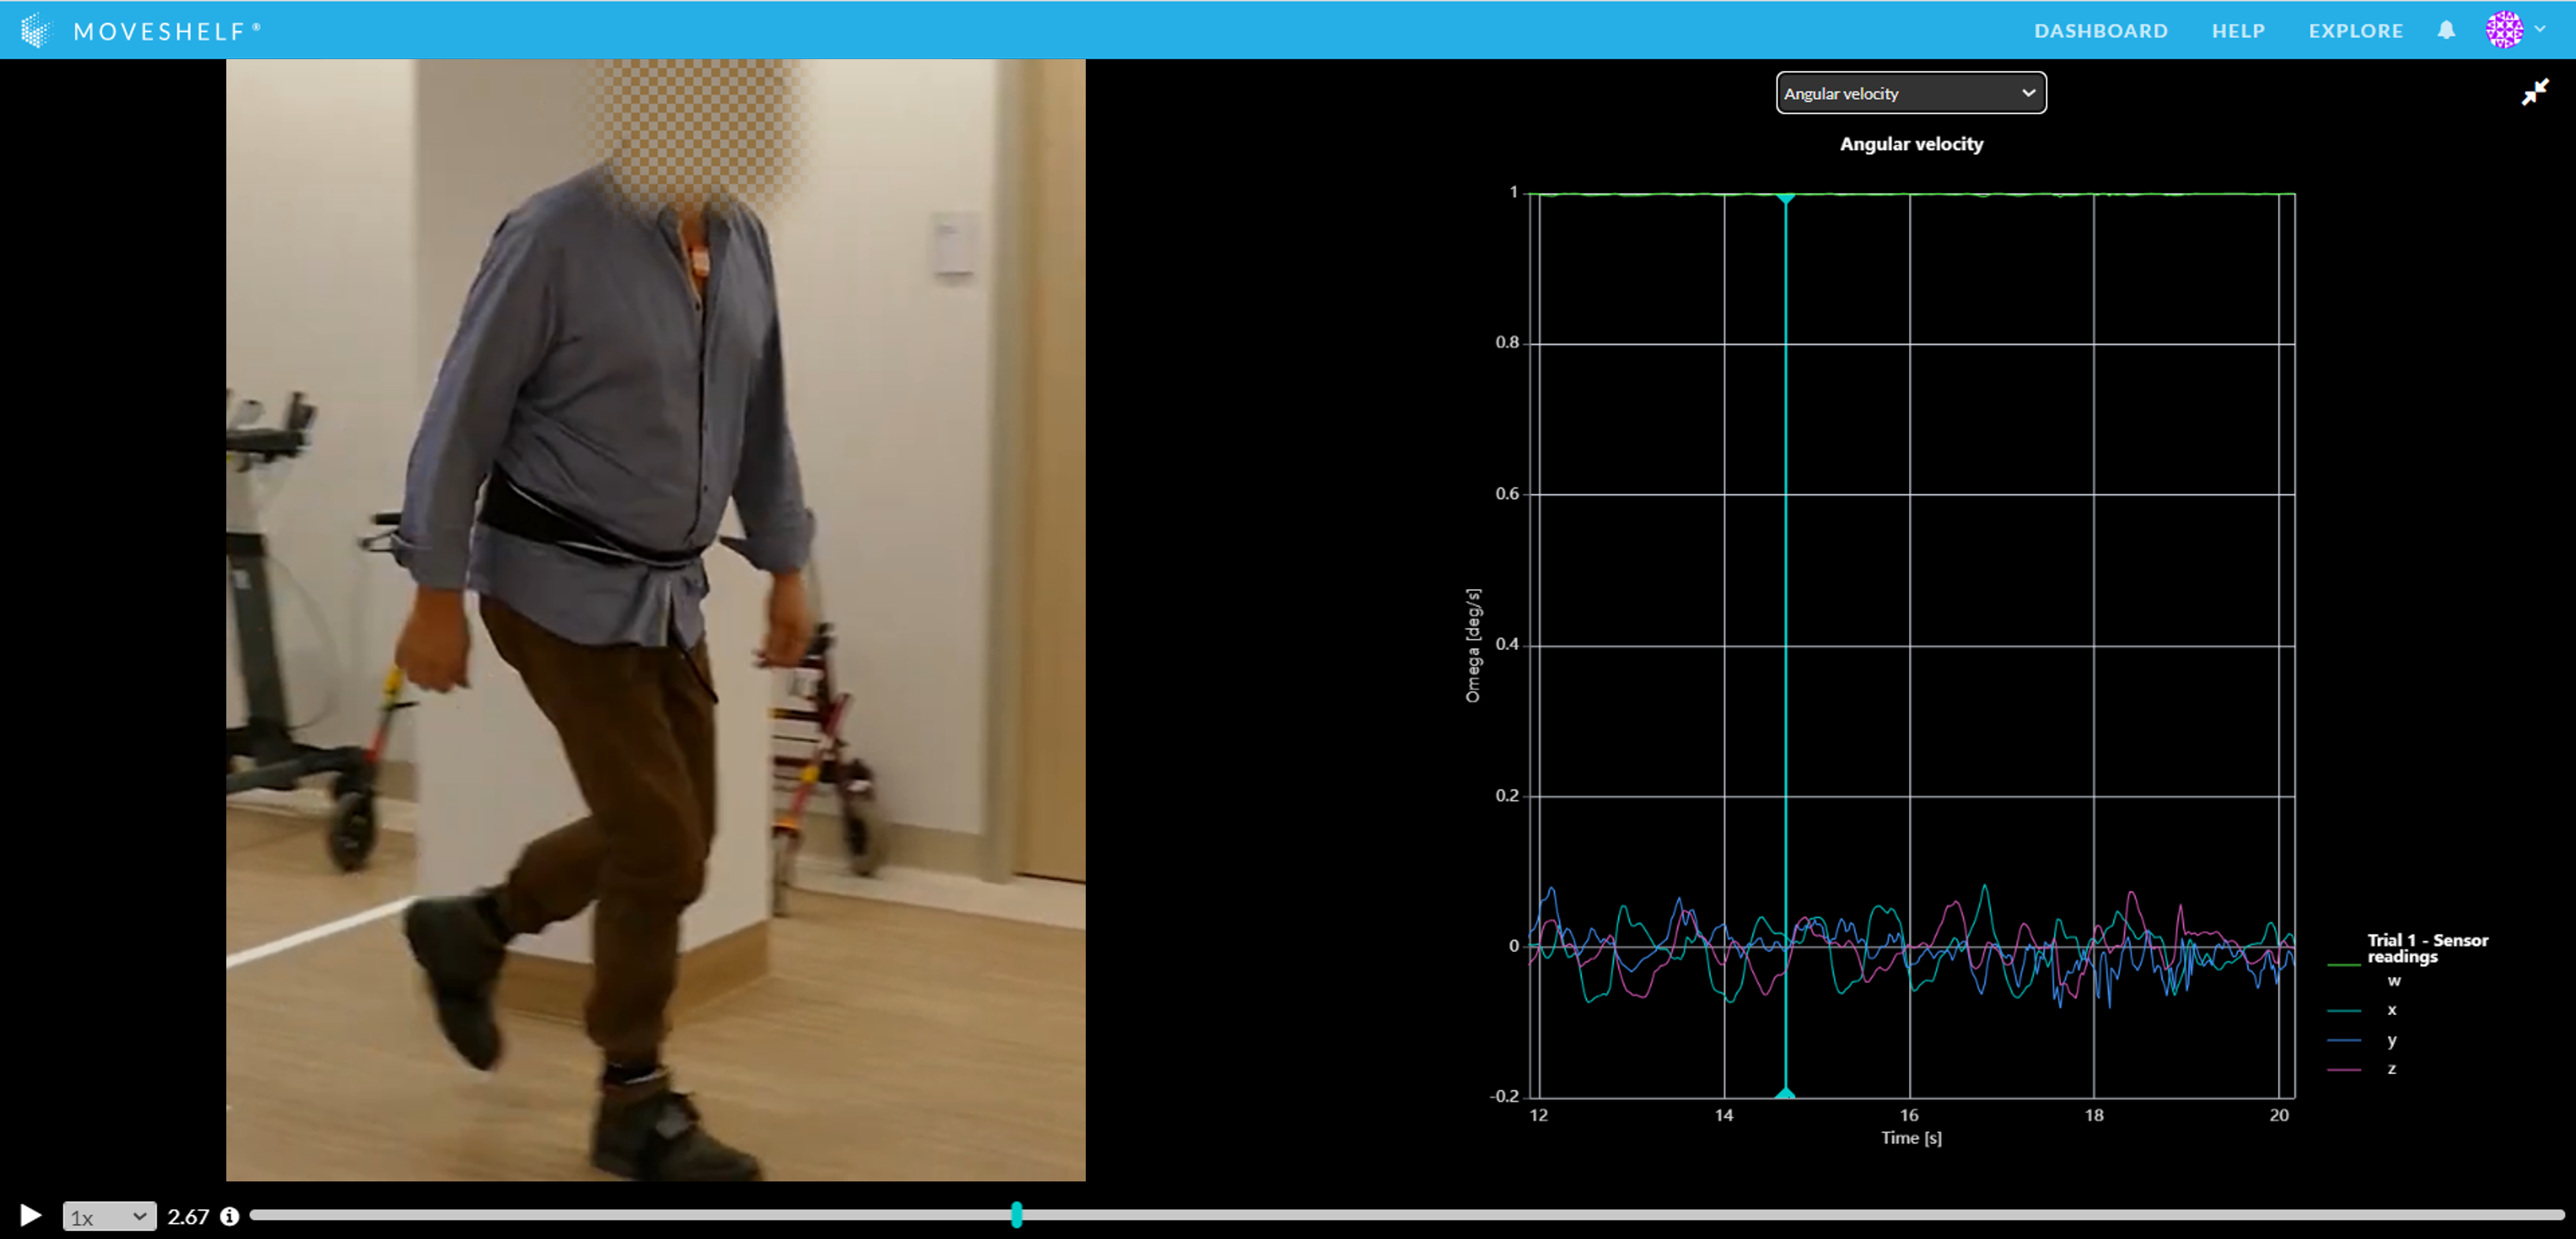
If you have used Xsens DOT + Video you will be able to view the sensor data synchronously with the video. Graphs will automatically be zoomed in on the data for the part that contains video when looking at them in split screen (read more instructions and hints about split screen
here). This can be done by following the steps below:
- Click on one of the trial names in a condition summary that includes a video you would like to view
- Select up to 2 graphs and the video for either the left and/or right side of the screen by clicking on the small arrow at the top left of the graph/video (the icon appears when hovering over the graph with your mouse).
- Next, click on the 'split screen' icon right next to the previously mentioned arrow icon to open your selection in the split screen (full screen).