Prefer using email? Write us at hello@moveshelf.com
| Setting | Explanation | |
|---|---|---|
| Graph lines & 3D player colors | All graphs & 3D player | Color for left, right, neutral, and reference; applicable to all graphs, timebar events and 3D player. |
| Background color | All graphs | The background of all graphs can be set to either the default dark or a white background. |
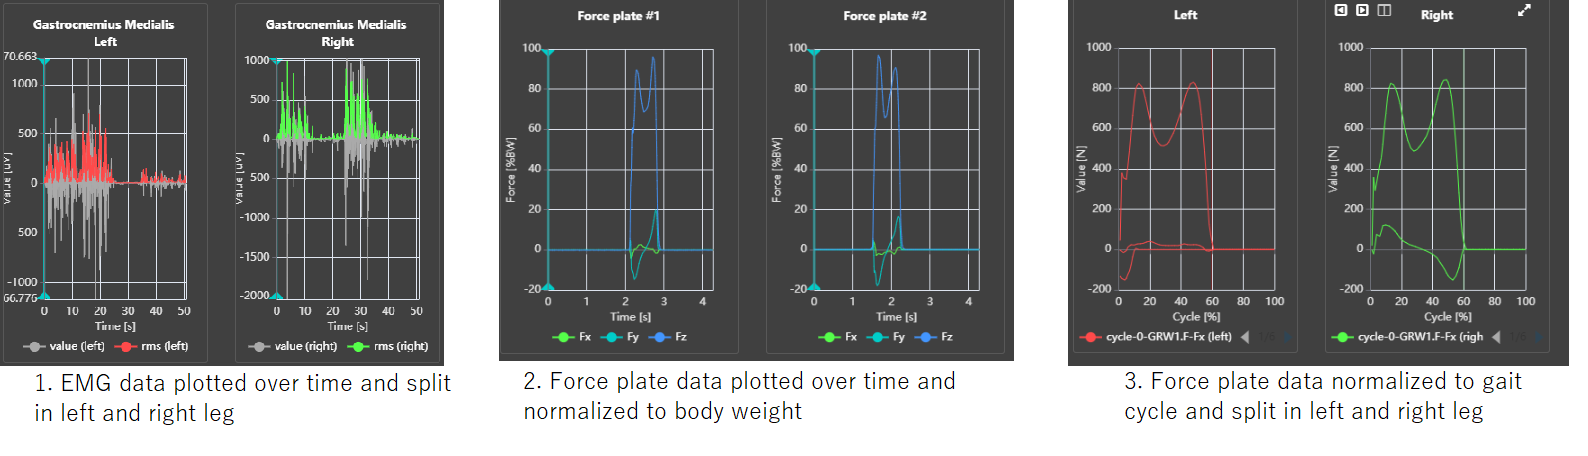
| Force normalization | Force graphs | Force plate data can be visualized in absolute values (N), normalized to body weight (%BW) or normalized to body mass (N/kg). These options are only possible if the body mass is correctly provided, see section Vicon directory upload. |
| X-axis normalization | EMG / Force graphs in trials | EMG and force plate data can either be plotted against a time scale (image 1 and image 2) or normalized to gait cycle (image 3). |
| Raw / RMS EMG | EMG graphs | Option to show only raw and/or RMS. By default both are shown and can also be disabled temporarily by clicking in the graph's legend. |
| EMG consistency | Time-based EMG | EMG graphs are shown by default as individual graphs. With an additional setting you can get an EMG graph type which overlays all EMG channels of one leg (e.g., Left) in one 'EMG consistency' graph. This can be useful for analyzing crosstalk and relative timing of activation patterns. See also the section on EMG consistency graphs. |