Prefer using email? Say hi at hello@moveshelf.com
| Setting | Explanation | |
|---|---|---|
| Naming | All graphs | Graph names and Y axis labels (e.g. Flexion / Extension). |
| Color | All graphs | Color for left, right, neutral, and reference; applicable to all graphs, timebar events and 3D player. |
| Defined Y-axis limits | All graphs | Fixed Y axis limits can be specified for each graph. When viewing the data on Moveshelf you can then easily switch between fixed limits or automatically-adjusted limits that perfectly fits the data. |
| Show stance-to-swing transition line | All cycle-based graphs | If this setting in enabled, and the gait event 'Foot Off' is detected for all gait cycles in a C3D file, a vertical line is drawn in every cycle-based graph at the transition of stance to swing phase for each detected gait cycle. |
| Additional, configurable group of graphs | All graphs | This feature allows you to group any graph together and create a new and customized data header with this content. For example, this feature can create a 'Sagittal overview' with sagittal kinematics, moments and powers for the hip, knee and ankle joints. This new data header shows up on top of the other data, above the data header of e.g. "Kinematics" and can also be selected to open in split screen. |
| Subset of parameters | Spatiotemporal parameters | Only show a certain subset of spatiotemporal parameters as default template in reports. |
| Subset of graphs | All graphs | Only show a certain subset of graphs as default template in trials and/or reports. For example, this can be of used for hiding a grounding channel for EMG or channels that only contain zeros as a result of restricted degrees of freedom for a joint in its biomechanical model. |
| Additional report template(s) | All graphs | With additional report templates you are able to upload divergent versions of your usual data format specifications or apply alternative predefined subsets of graphs to visualize in you report. More information can be found here: Additional report templates. |
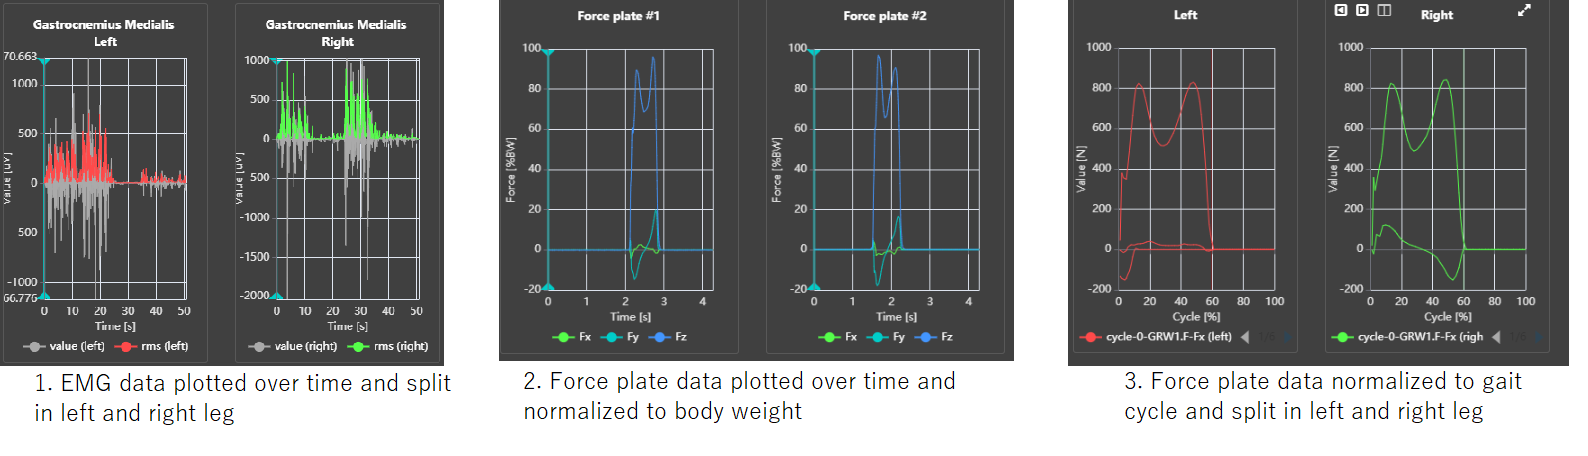
| Force normalization | Forces | Force plate data can be visualized in absolute values (N), normalized to body weight (%BW) or normalized to body mass (N/kg). These options are only possible if the body mass is correctly provided, see section Vicon directory upload. |
| X-axis normalization | EMG / Forces | EMG and force plate data can either be plotted against a time scale (image 1 and image 2) or normalized to gait cycle (image 3). |
| Left / right separation | EMG / Forces | To make the data more organized, EMG and force plate data can be plotted in separate graphs for the left and right leg (image 1 and image 3). |
| Organize EMG graphs per muscle | EMG | This setting organizes EMG graphs by grouping left and right side graphs for each muscle. |
| Raw / RMS EMG | EMG | Option to show only raw and/or RMS. By default both are shown and can also be disabled temporarily by clicking in the graph's legend. |
| EMG consistency | EMG | EMG graphs are shown by default as individual graphs. With an additional setting you can get an EMG graph type which overlays all EMG channels of one leg (e.g., Left) in one 'EMG consistency' graph (see image). This can be useful for analyzing crosstalk and relative timing of activation patterns. When enabled, the EMG consistency graph is shown below the individual EMG graphs and can also be viewed in split screen. |