Would you like to hear about webinars we're
doing, new features we're adding and projects we're undertaking? Sign up
here to our pleasantly infrequent newsletter!
Reports can be found within a subject's session, or you enter a report through an URL shared in the EPD or by a colleague. A report is an overview of two or more trials, where numeric data is combined and overlaid in graphs, and videos from different trials can be played right next to each other. See section Split screen on how to do this and more great ways to compare different data and media in one customizable view. Under the header ‘Trials in report’ you can see all trials and optional references that are included in this report. Different conditions in reports are indicated by unique line styles in the graphs. The operator will have prepared a report as either a
comparisonA comparison is best suited for analyzing differences between conditions and/or sessions. When creating a comparison report, all trials are included in one report, grouped per condition and session.
, or a
condition summaryA condition summary is best suited for consistency and/or variability analysis. One report will be created for each condition, combining all trials of that condition.
.
Explore data in the report
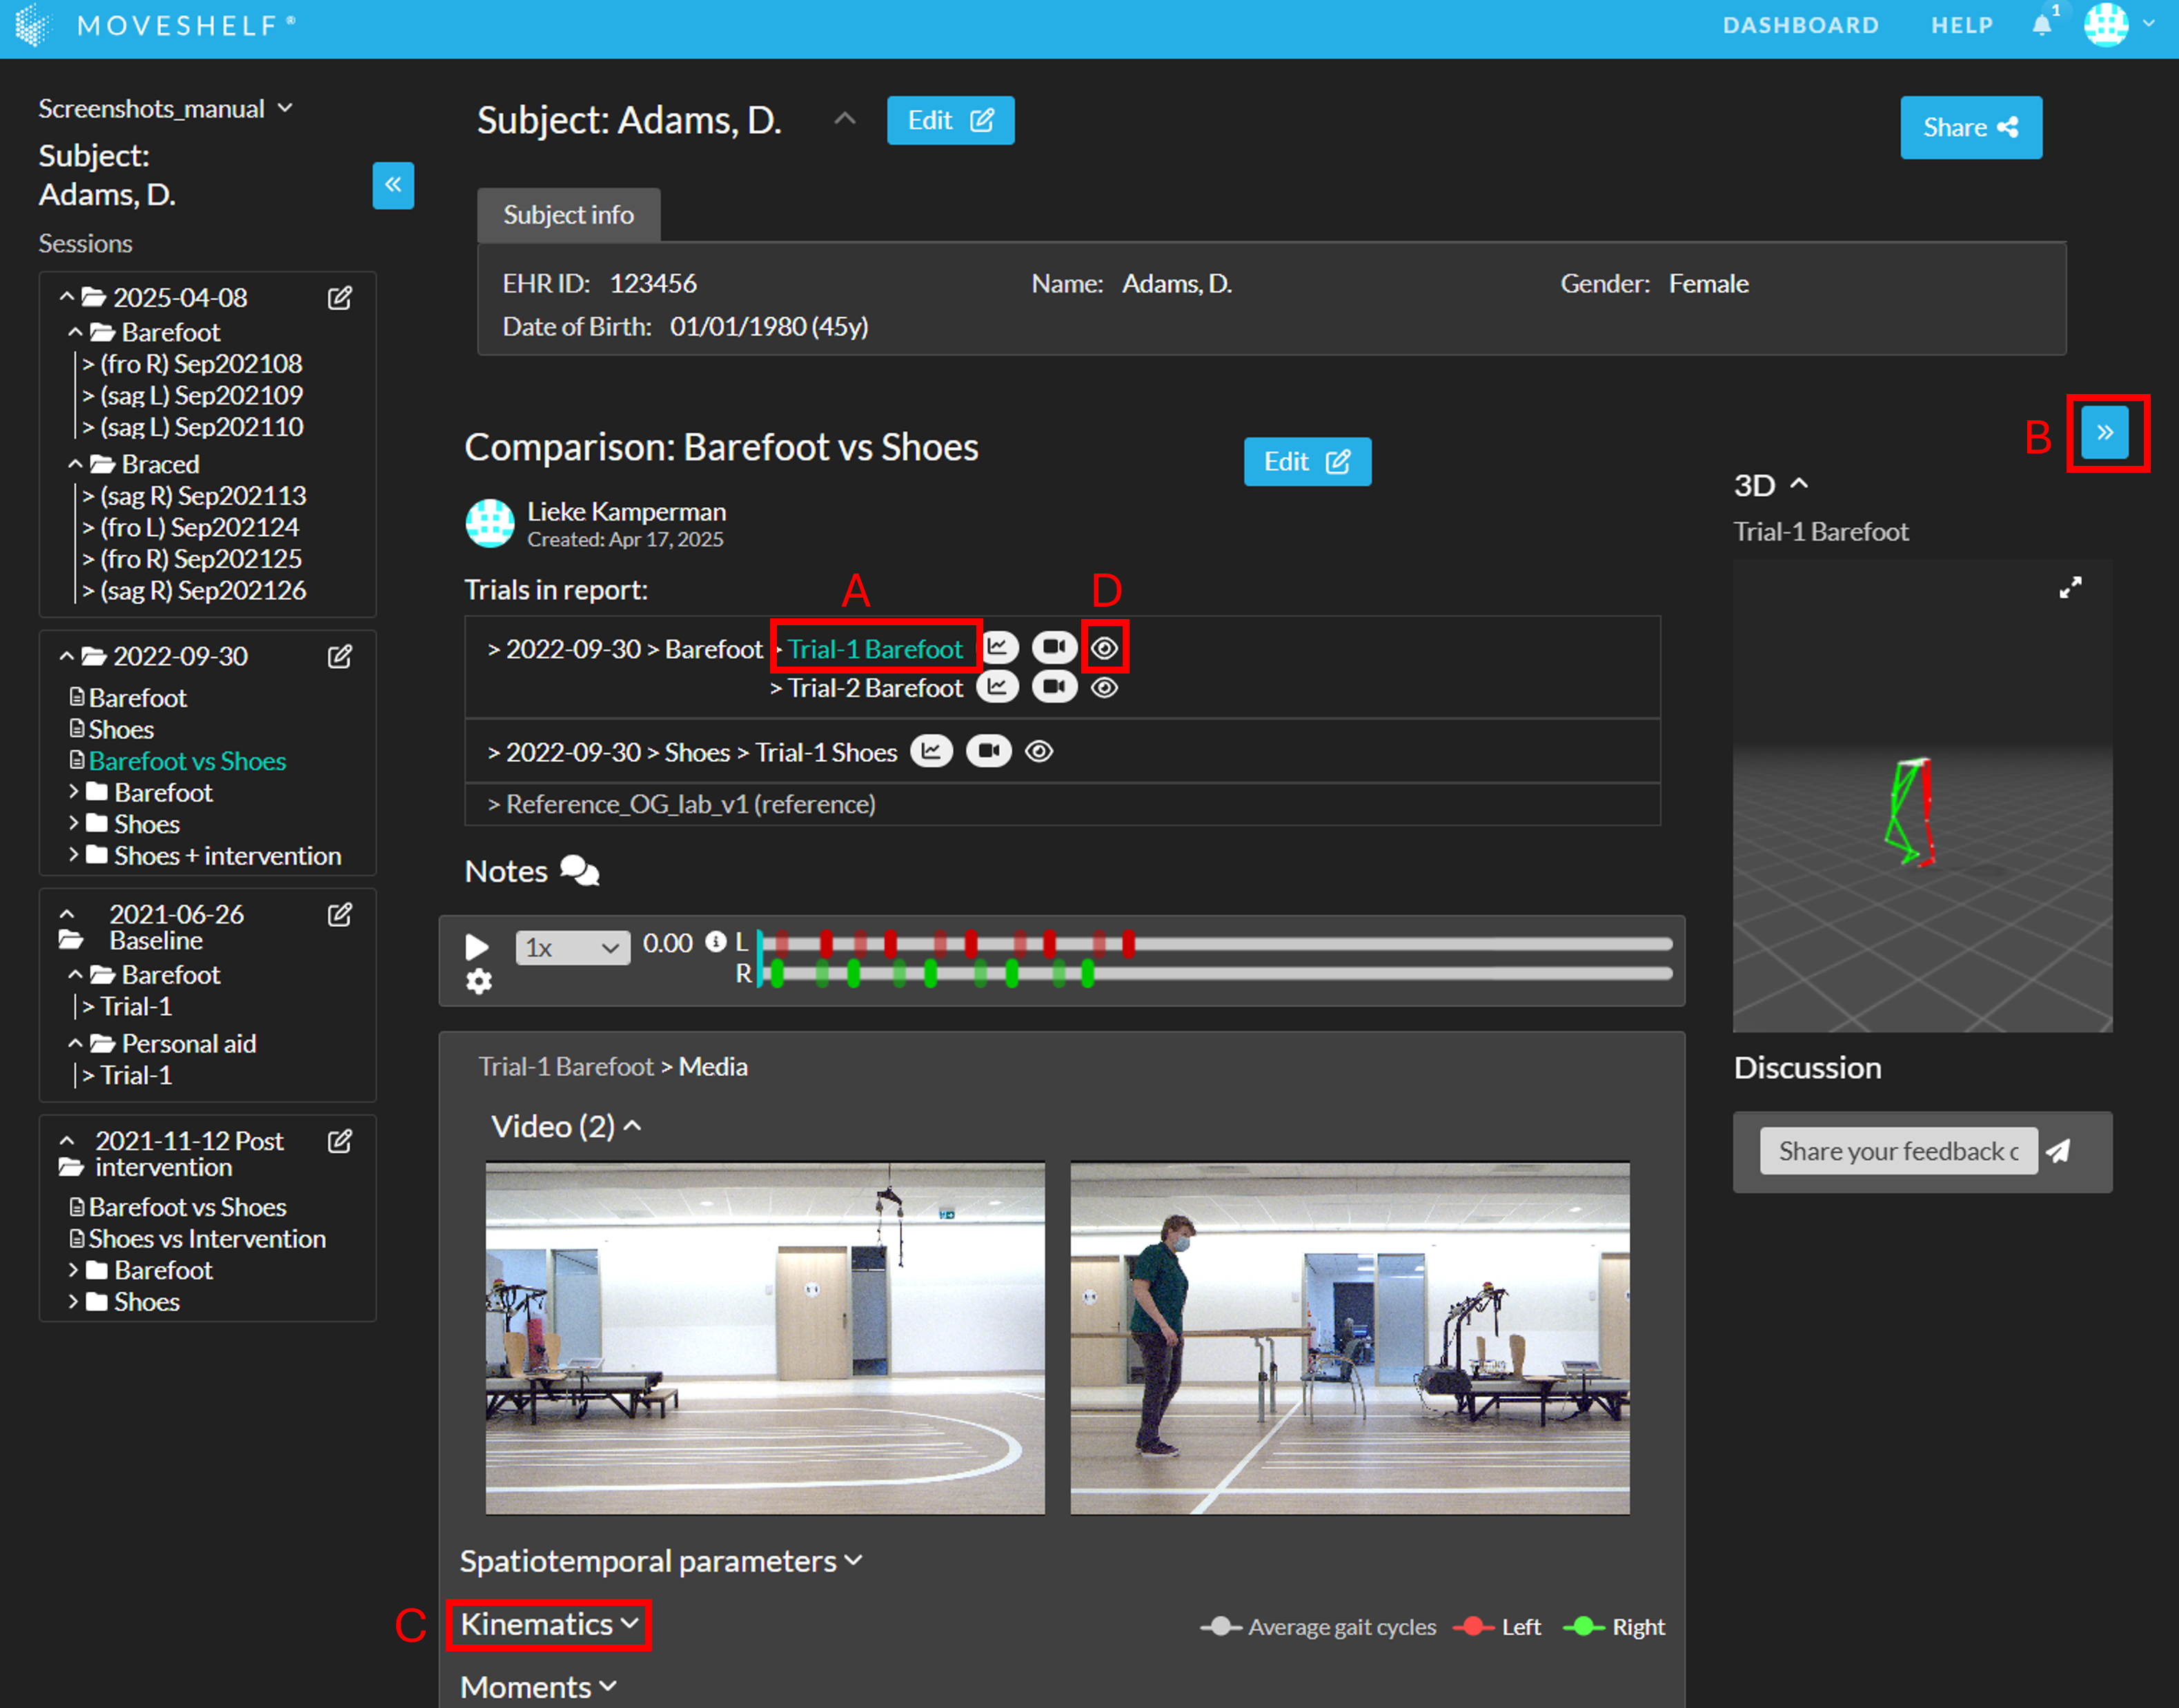
To view the 2D video and/or 3D avatar of one of the trials, click on the trial name below the header ‘Trials in report:’ (see A in screenshot below). The 3D avatar will be shown on the right side of the page. If the right sidebar is hidden, click "<<" to open it (see B in screenshot below). The 2D videos will displayed just below the playbar.
To open other types of data in the report (e.g., Kinematics, Moments, Powers, EMG) click on the header of the data type you would like to view (see C in screenshot below).
Click on the 'eye' icon to hide/show all gait cycles of a trial from the report (see D in screenshot below, or the video). Please note this feature only works for graphs with individual (non-averaged) gait cycles. For other graph interactions, see this section.
 Show/hide trials in graphs in a report: